Vroom Vroom
My son loves it when I hit the gas in the car. When he wants me to speed up he says, “let’s do the vroom vroom, daddy!”
That just means – floor it! He gets a cheap thrill when I press the pedal to the floor.
Just a handful of stocks have the vroom vroom, while others are letting off the gas. Cars and markets are more fun when there is “vroom vroom.”

Stocks Lost The Vroom Vroom
If you ask people, “does the stock market go up every day?” I’d wager that most would say yes.
I mean, the media seems to suggest it.
But, have the markets been going up day after day? Our data signals that most stocks have lost the vroom vroom.
Since early June, let’s look at how the major indices performed. This is also the area where we saw the largest buying ever in our history in ETFs and stocks.
We saw record breakers in our data. We positioned for lower prices then.
Since June 8th, here’s how the major indices have performed:
- SPY (S&P 500 ETF) +.02%
- IWM (Russell 2000 ETF) -3.64%
- DIA (DJIA ETF) -2.38%
- QQQ (NASDAQ 100 ETF) +8.20%
Bottom line: the S&P 500, Russell 2000, & DJIA are all flat to negative and the NASDAQ has the vroom vroom.
What did those indices do the 2 months prior? I’m glad you asked!
Here’s their performance from April 8th – June 8th:
- SPY (S&P 500 ETF) +17.94%
- IWM (Russell 2000 ETF) +29.66%
- DIA (DJIA ETF) +18.20%
- QQQ (NASDAQ 100 ETF) +20.43%
Bottom line: everything rallied in unison. That’s a classic “tide lifts all boats” kind of rally.
To us, it is clear as day that something changed since June 8th. This is when we expected lower prices. While most stocks lost the vroom vroom, the NASDAQ clearly kept zooming.
Big Money Index Loses The Vroom Vroom
The BMI measures all stocks equally weighted. So, if Apple Inc. (AAPL) gets a big money buy signal and Chipotle Mexican Grill, Inc. (CMG) gets a sell signal, they each have the same impact.
In other words, our data isn’t market-cap weighted.
In the stock market though, if Apple goes up and Chipotle goes down, (all things being equal) likely the market indices will go up. That’s because Apple is ~52Xs larger than CMG. As you know, Apple is a huge weighting in the DJIA, S&P 500, & NASDAQ 100.
So, when our data picks up on less buy signals (decreasing number of stocks making buy signals), you see a declining Big Money Index.
This is what deteriorating breadth looks like:
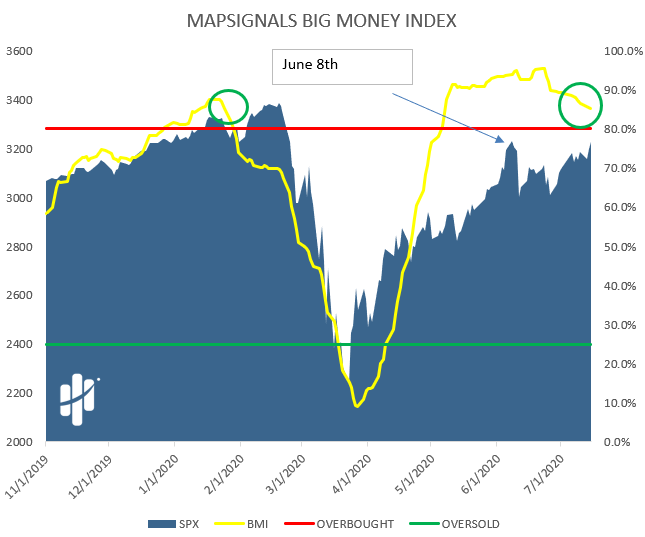
Reminder: the recent peak in the S&P 500 was on June 8th.
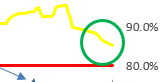
Here’s the 2 months prior to June 8th. The BMI is going straight up and the market (S&P 500) rallied 18%.
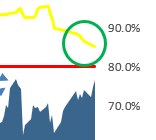
Here’s since June 8th. The BMI flat-lined then started to fall. When the Big Money Index loses the vroom vroom, markets stall:
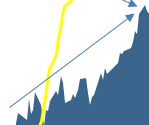
Whoops! You can’t really see the market from this height after June 8th. Let’s expand that out:
To me, it looks like the last 6 weeks were a huge sector rotation into a few tech stocks and out of everything else. Let’s keep going.
Number Of Stocks Seeing Big Money Buying Is Low
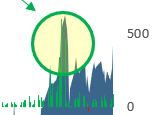
Here’s the daily net buy and sell signals overlaid on the Russell 2000. Off to the right, I circled the vroom vroom buying in June 5th & 8th:
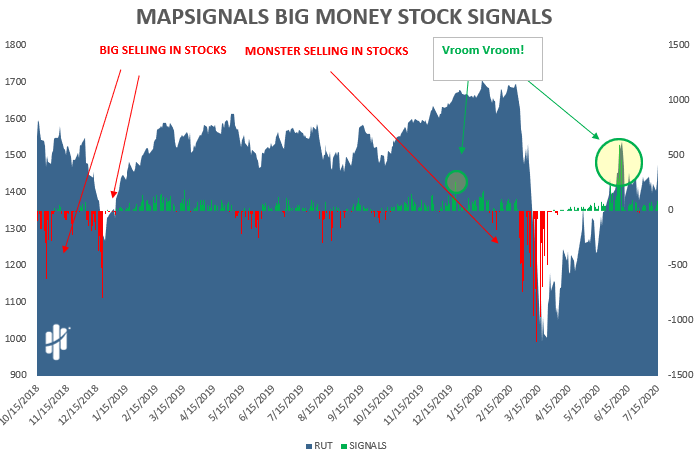
Then you can see the green trees became baby stalks after June 8th:
The Russell 2000 ETF (IWM) is down 3.64% the past 6 weeks. This makes the most sense (compared to our data) because the index is more equally-weighted compared to the big-cap indexes.
But, the sector vroom vroom has fallen incredibly. I.e. the number of stocks making big money buy signals keeps dropping.
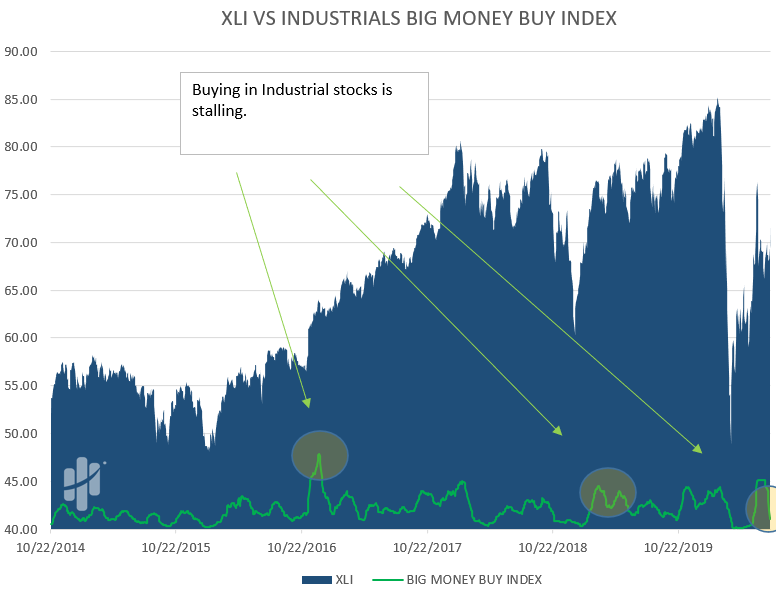
Sector Bad Breadth
This is the same story for weeks. The big buying that sent markets to peaks in early June has no bearing on today’s data. We’ve now reached the 5-week moving average that doesn’t include those epic buy days.
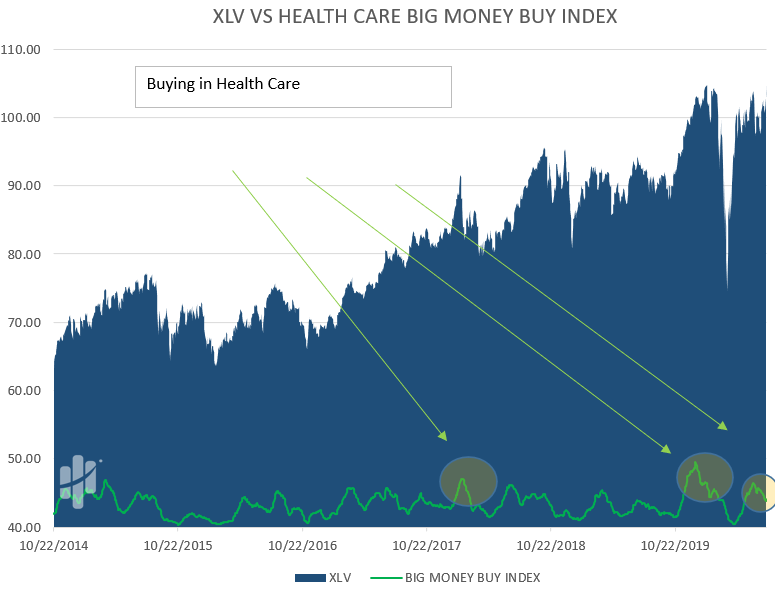
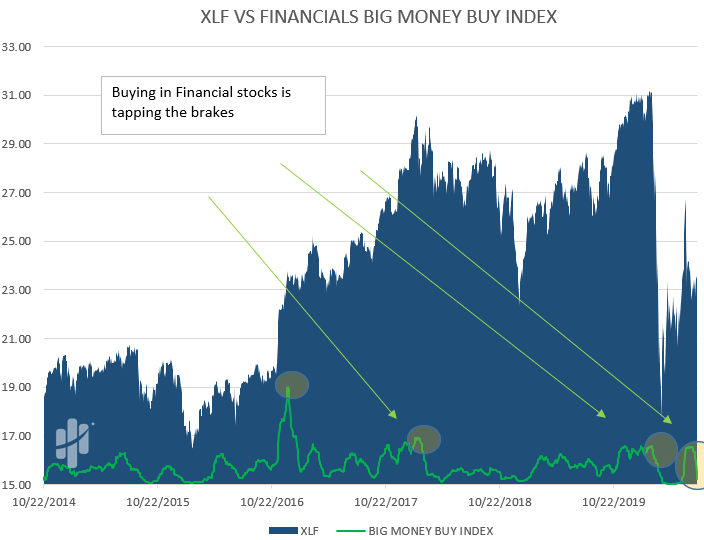
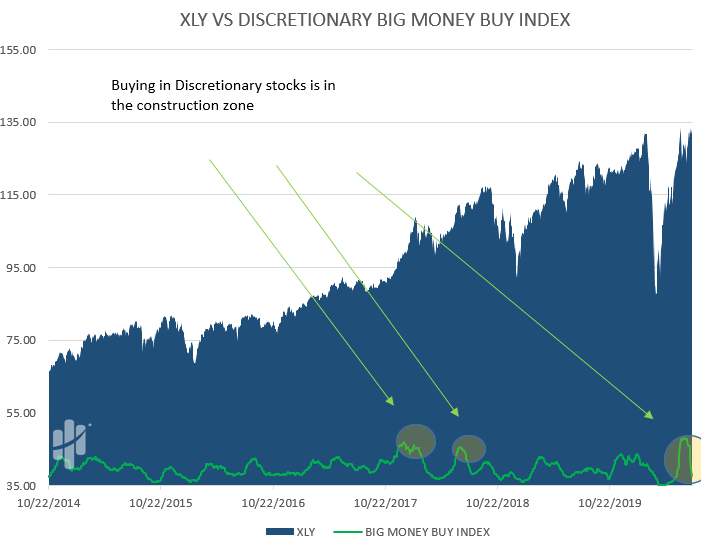
If the green line is falling, it means the number of buy signals is slowing (equally-weighted):
Industrials & Materials:

Healthcare & Technology:
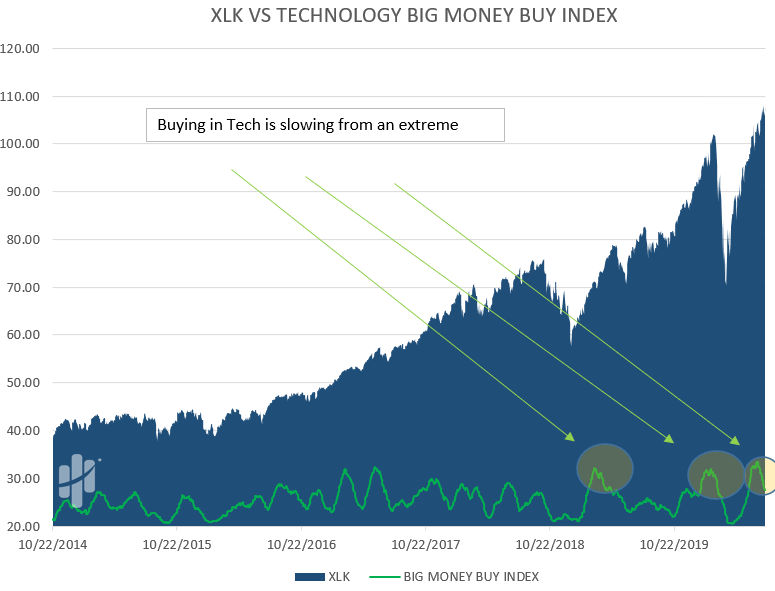
Energy & Financials:

Discretionary & Real Estate:

Technology Stocks Go Vroom Vroom
Now, if the juice has been limited to one group (Technology), did our data see it?
Well, you decide.
Below is the MAP 50 for July. This is a members only list of stocks showing the most buy signals over 6 months.
In general, we want to follow the Big Money. That’s where we find the outliers. Here’s the sector concentrations for our Top 20 lists over the past 6 months. If you look closely, you’ll see where our data saw the juice.
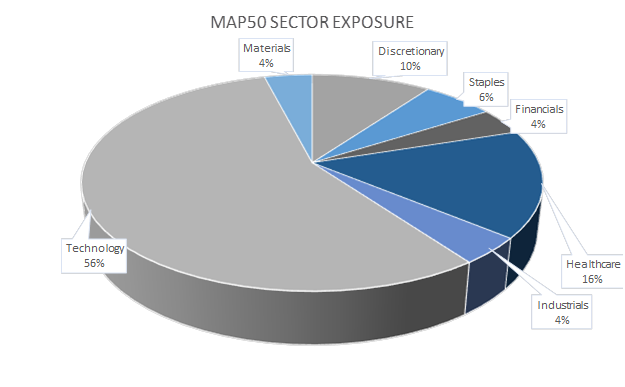
That’s right – Technology stocks are the ones gunning the market higher- “vroom vroom!”
Bottom line: most major U.S. indices are flat to down since the highs reached in early June. Only the NASDAQ has the juice.
Our narrative can’t shift until the data does. Maybe buying will start to pick up today or next week. Maybe selling will. Who knows?
Either way we have come to learn that it’s always Big Money that leads the way. And right now, they feel like going vroom vroom on a handful of Tech stocks.
That puts on a nice show- but also distracts from the real picture that all the other stocks and indexes aren’t.
We still feel selling will inevitably take over and correct the market. While it might be frustrating looking for that confirmation in what our data has been saying, pulling back the curtain you can see that only a handful of stocks are going vroom vroom…
(DISCLOSURE: MAP or it’s founders hold a long position in CMG)