Record Breakers
Records are made to be broken.
This holds especially true in the stock market.
And this week has a few record breakers. Buying levels shattered prior glass ceilings across the board.
That sounds good, but is it? When overbought conditions become extreme like now, it often signals the late stage of a market’s bull run. The checkered flags might be near for this leg of the never-ending market race.
3 key data points explain why.

ETF Record Breakers
At Mapsignals, perhaps the best retail indicator we look to is what’s going on in ETFs. When our data shows us people are likely buying ETFs in droves, it’s usually a bad sign. It often foretells of a market pullback – or at least a cool-off period.
Last week we pointed to new information popping up in this post. We showed you how buying in ETFs was picking up. And since then, the theme intensified.
When we looked this morning, we saw yesterday’s ETF activity broke our records: it was the single biggest day of ETF buying in our history going back 30 years. The first ETF, SPY, started trading in 1993.
Below we see a different way of visualizing the Mapsignals Big Money ETF Index. It tracks the daily buys and sells of ETFs. Green bars mean net buys and red bars mean sells. I’ve circled this morning’s activity way off to the right. I’ve also circled 2 prior record breakers of extreme ETF buying in recent history: January 12, 2018 & January 2, 2020.
Have a look:
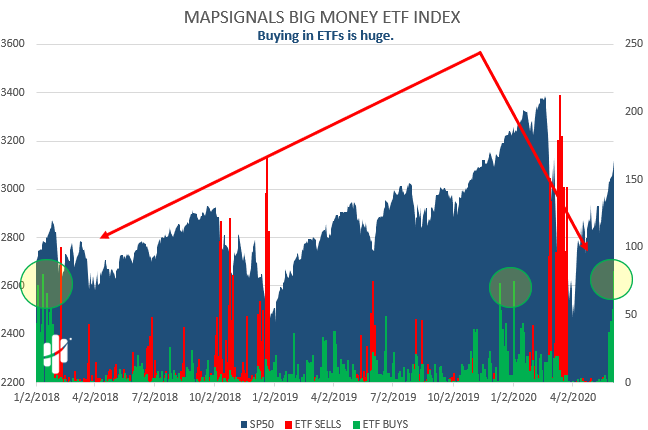
Those earlier points are important: markets pulled back weeks and sometimes just days later.
When ETF buying is breaking records, start looking for the bull run’s checkered flag.
Huge Stock Buying
Stocks are breaking records, too.
Our data often dovetails and correlates. For instance, when we see big ETF buying, we usually see huge stock buying too. That’s precisely what we saw this morning.
The level of green (net buying of stocks) is nearly breaking records. Below is a chart of daily buys and sells for stocks. A green bar means it was a net buy day for stocks, while a red bar means net sellers.
This morning we see that yesterday was a monster green bar. Check it out:
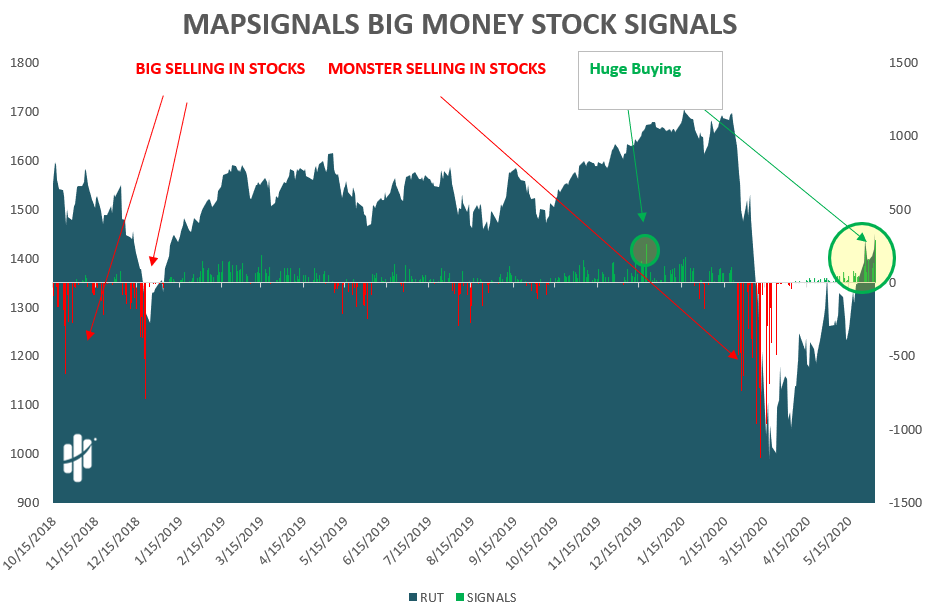
This was the 10th highest day of buying in our 30-year history – 7,521 trading days. Before yesterday, we haven’t had a day this green since November of 2016. So, what does it mean?
It means exuberance is high. Remember when Alan Greenspan said “irrational exuberance”? Overexcited buying can be FOMO. It’s typically the last straw for an overbought market to get extreme.
Stocks have been overbought for 4 weeks now, which is very normal. Today is the 20th overbought day. Twenty days is the historical average that an overbought period lasts after a huge washout like in March.
The good news is overbought markets are like the investing bonus level. Stocks and portfolios tend to rack up big gains in times like these. But, all good things must come to an end, or at least slow down. Right now, signs point to a frothy overbought market.
It’s time to be cautious.
Extreme Big Money Index
We now know overbought extremes can last for a while. We know this by looking at the Big Money Index. Like I said, it’s been overbought for a month.
When it begins to fall, pay attention. The market tends to follow the BMI, just like goslings follow their mother.
As you can see, we are clearly at an extreme point:
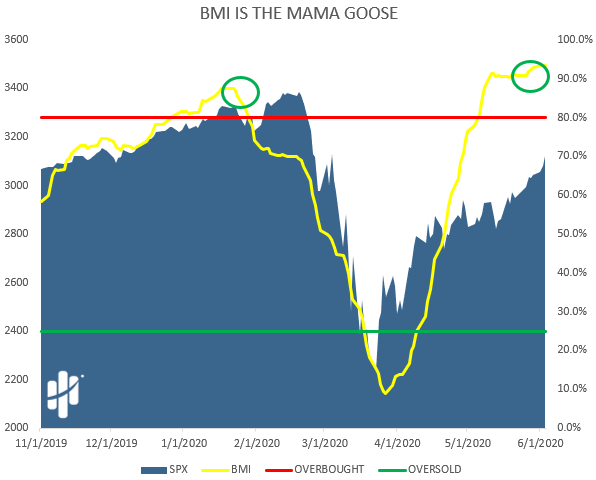
Until selling picks up, the BMI will stay overbought. But nothing good lasts forever.
For now though, as we’ve pointed out, our data points to record breakers.
So, what do we do?
The bottom line is our data is signaling extremes. The litmus test is saying: enjoy the ride up here, but don’t expect it to last forever.
To be clear: we are not saying markets will crash.
But we trust history. And if history is any guide, we’ll see a pullback in the coming days or weeks.
And that’s a great thing because you tend to see deals on great stocks!
The end of the latest stage of the market race is in sight. Prepare by trimming some profits and having some cash ready to deploy on deals when they come around the corner.
We know because data told us so. In a clear sign…
It’s just like when the checkered flags are waving at the end of a race.