
Waiting on the All-Clear Signal for Stocks
It’s hard to surf in choppy waters. Messy disorderly waves create a challenge to hang ten.
The same goes for the stock market. Volatility is keeping major indices bobbing and weaving.
If you’re waiting on the all-clear signal for stocks, keep waiting. Institutional money flows still point to near-term weakness.
No doubt about it, it’s rough out there. Investors are facing another sad-faced August with stocks down across the board. The S&P 500 is off 3.3% MTD. Small caps are doubly worse with the Russell 2000 shedding 6.6%.
Yuck.
While this feels unpleasant, it’s right in-line and expected with our summertime pullback playbook.
If you’re thinking about dipping your toes in this market, go ahead. Just don’t fully submerge just yet. Odds are there’s more downside coming.
Waiting on the All-Clear Signal for Stocks
If you want an edge in trading, get on the right side of the Big Money. Supply and demand is the ultimate power law of the market.
When money’s rushing into stocks, they bounce. When money’s gushing out, they fall. Our Big Money Index (BMI) plots these waves beautifully.
Lately, there’s been a major character shift in our data. Beginning in August, buying has dried up as selling has increased:

When the BMI’s in freefall, it’s telling you the tide is going out of stocks. It’s difficult to fight that trend.
In 3 weeks, the BMI plummeted from 83.9% (overbought) to this morning’s reading of 58.1%. That’s 25 points.
Below reveals why there’s been such a downshift. The daily action reveals how buying has ground to a halt and selling is increasing.
Check it out:
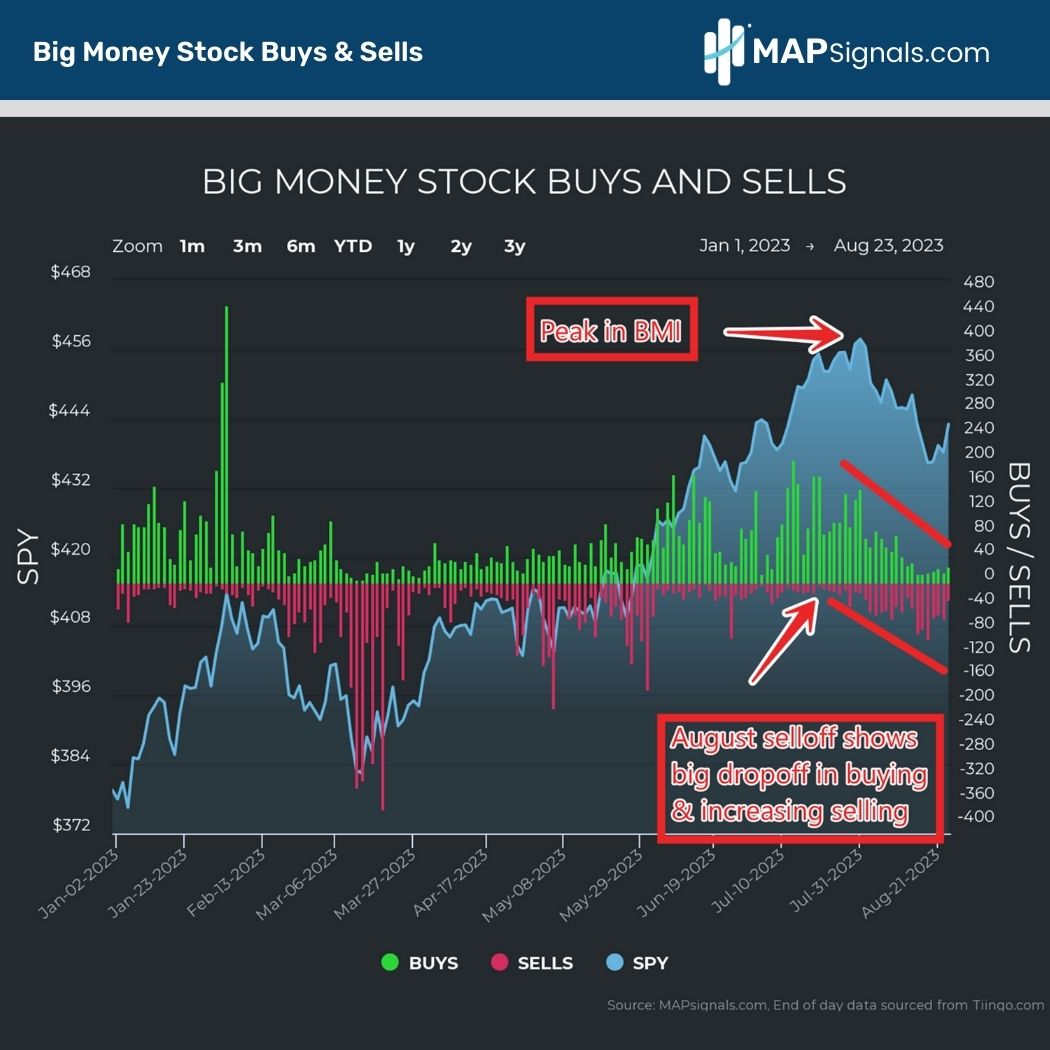
The data is clear as day that bids are fading. Deals are finally showing up as Discretionary, Staples, and Healthcare names face overhead supply. This week in particular has certain stocks beginning to look attractive.
That’s great news! BUT here’s why I believe the full brunt of this pullback has yet to be felt. If I make forward projections on the BMI, it’s slated to fall. If that’s the case, I’ve learned to assume that equity weakness will follow suit.
Check this out. The BMI is built on a 25-day moving average of buys and sells. The index gives equal weight to the last 5 weeks of trading.
Here’s why it’s falling hard. The first 8 days from 7/20 – 7/31 shows an average daily buy ratio of 87.3%. In other words, nearly 9 out of 10 signals are buys. That’s monster-sized inflows.
Contrast that to the prior 15 trading days where the average buy ratio is only 41%, indicating outflows in 6 out of 10 stocks:
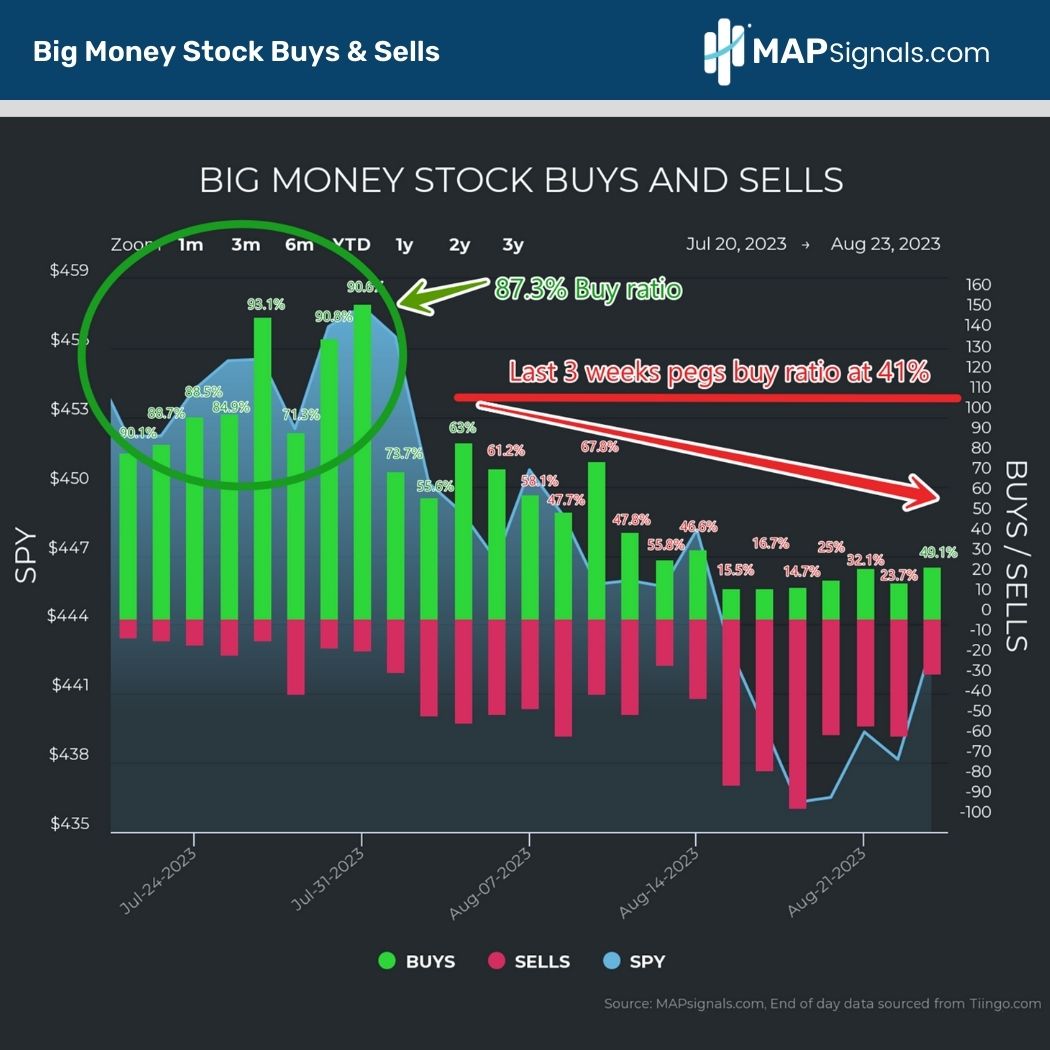
That’s a wave of selling that hit markets hard. Those big green bars circled above are quickly going to work their way out of the BMI calculation, further dropping it in the days ahead.
This is why I see the near-term trajectory as lower. Only when the tide shifts back into stocks can we clearly assume that the trend has changed in favor of the bulls.
Forget the media headlines that change day by day. Rather, focus on the wave. The Big Money flows in 4 phases:
- 1. Huge buying and little selling (late July)
- 2. Buying slows & selling grows (early August)
- 3. Buying slows further, selling takes over (where we are now)
- 4. Buying is gone, sellers are in control (the best buying opportunity)
We appear to be well into phase 3:
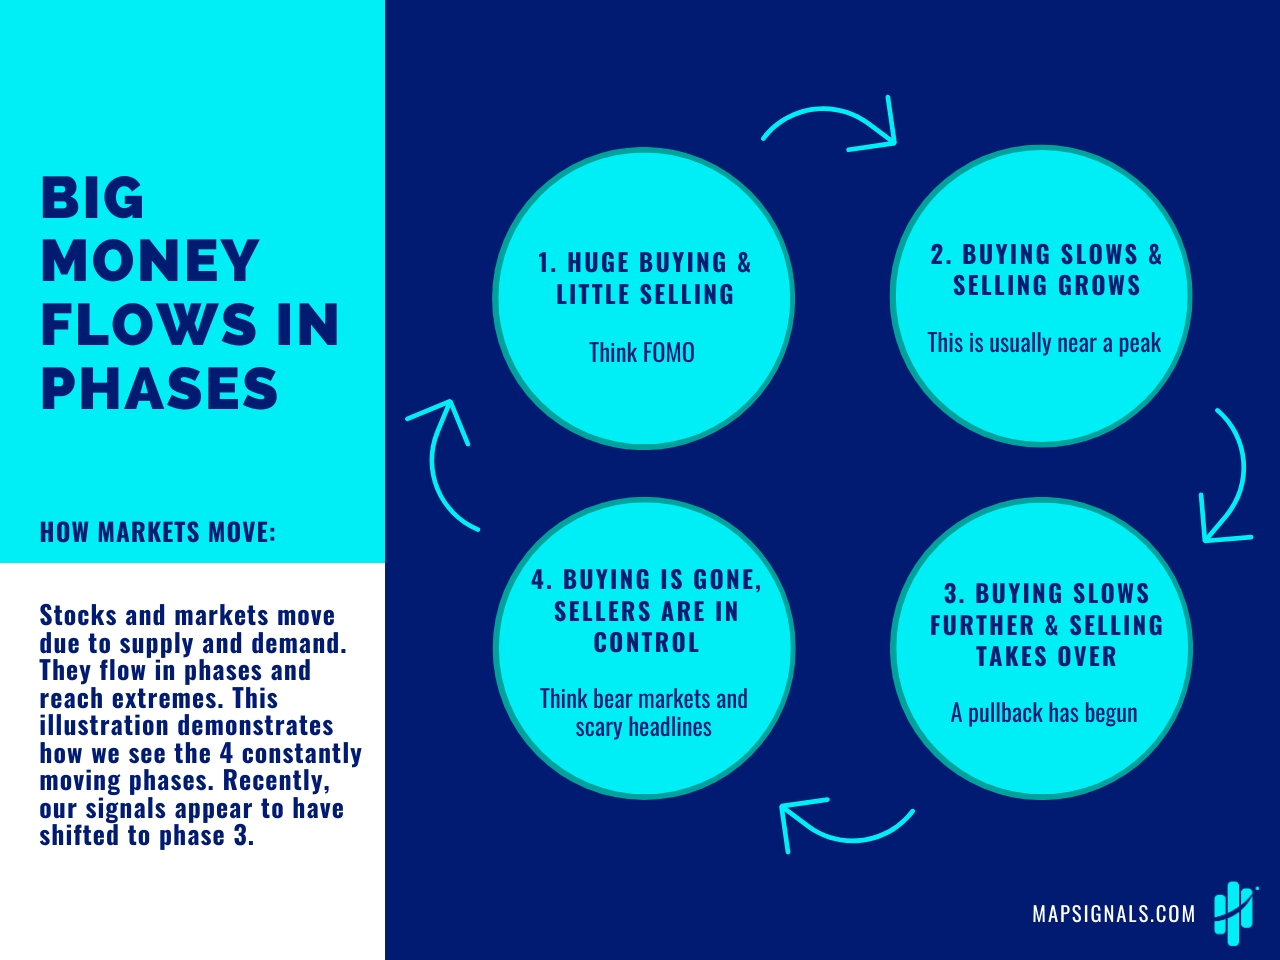
Keep in mind, phases 3 and 4 are where the money’s made. Risk-off markets, while hard to surf, offer opportune times to grab great stocks unfairly punished.
You can keep waiting on the all-clear signal for stocks…just don’t wait too long. By the time the BMI starts heading north, the best surfing swells will have begun.
Let’s wrap up.
Here’s the bottom line: The downtrend is here and the BMI points to further weakness. Expect the BMI to drop hard in the days and weeks ahead, leading the market lower.
Take the time now and use the pullback for what it truly is: a wonderful time to buy stocks on sale.
Eventually the tide will shift back in favor of the bulls. Until then, wait for the data to confirm institutional appetite.
As super surfer Laird Hamilton once said, “Surfing’s one of the few sports that you look ahead to see what’s behind.”
At MAPsignals, we see the market the same way. And you should too!
Don’t surf the market’s blind. If you manage money or are serious about investing, follow the Big Money waves with a MAPsignals Pro Subscription.
Have a great week everyone!