• Menu
  • Skip to right header navigation
  • Skip to main content
  • Skip to primary sidebar
  • Skip to footer

MAPsignals

We map big money.

  • Latest Insights
  • Power of MAP
    • MAP Products
    • MAP System
    • MAP White Papers
    • Videos & Interviews
  • Profit with MAP
  • About
    • About MAP
    • MAP Team
    • Authors
    • MAP System
    • MAP Products
    • Big Money Index
  • Members
    • Get Started With MAP
    • My MAP
    • Big Money Charts
    • MAP View
    • MAP View Options
    • MAP Top 20 Weekly
    • MAP 50
    • Member Updates
    • Platinum Updates
    • Members Only Posts
    • Performance
  • Portal

Weak Hands

September 17, 2020 //  by Lucas Downey//  1 Comment

New traders have to learn the ropes. There’s “no such thing as a free lunch.”

Weak hands is a financial term defined as new investors who lack conviction in their trades. Basically, they are the traders that see an opportunity on Wednesday but then see a disaster on Thursday.

Monster bull markets often bring out the weak hands. It works like this: stocks begin to rise. Then investors take notice and pile in. Prices go higher. People start feeling left out. Emotion kicks in. People start buying with less and less regard to logic. Valuations go out the window. Hot IPOs and SPACs become all the rage. FOMO fuels the fire. Finally, weak hands come in feeling emboldened with false confidence.

Eventually though, Mr. Market teaches all new traders a lesson.

The pendulum swings both ways when it comes to risk. Uncertainty means volatility. And volatile markets eventually swing into smooth upward trending markets synonymous with certainty. Investors become certain they will make money buying stocks.  And when making money is just too damn easy, stocks gap higher day after day. Then the FOMO creeps in allowing the weak hands to pile in.

We saw it happen and sounded the alarms. The big tip-off was with ETFs. Animal spirits were howling on September 2nd. The final buyers (retail) got sucked in and they pushed their chips to the center. As we’ve shown before, when ETFs get bought in size, be careful. Early September notched yet another example in the ever-growing data of market history.

Why does big ETF buying mean a red flag?

Because, Big Money tracks this kind of activity. Huge funds look for retail buyers full of glee and hope. When pros see hints of greedy buyers, they test the liquidity of the market. Meaning: a pro may sell a little stock to see how it trades. If it gets gobbled up immediately, it’s not time to sell. But when they sell and bids are soft, meaning it’s harder to sell – that’s when pros press: they start selling with abandon.

They push stocks down to capture profits on their shorts. It gets violent and ugly fast. So, when big money saw investors clamoring for ETFs, they knew hopeful buyers were here. It’s no mystery to us that the Tech market fell 10%+ soon after that signal.

WEAK HANDS

In accounting, there’s something called LIFO- Last In First Out. It’s an inventory accounting method. You sell the merchandize that most recently arrived first. Well, when ETFs got bought bigly, the “last in” quickly became the “first out”, as pro traders shoved prices down in their faces.

At MAPsignals, we actually see their pain as opportunity: We love buying the best stocks at discount prices.

So, was this hopeful buying a signal that the market is headed lower for longer?

We don’t have the all-clear signal yet for markets – but, our data suggests the bears’ days are numbered.

Big Money Index Reaches 4 Month Lows

The Big Money Index has sagged for weeks. That’s due to big money stock buying slowing, coupled with a moderate increase in selling. But that doesn’t necessarily mean the market as a whole is getting sold.

In fact, there’s a rotation happening. Technology leadership is slowing, while sectors like Industrials, Materials, & Discretionary are attracting capital.

Overbought markets can be described as when all stocks rally…the good and bad ones. That clearly is not the case currently. The BMI has been falling:

big money index plateaus

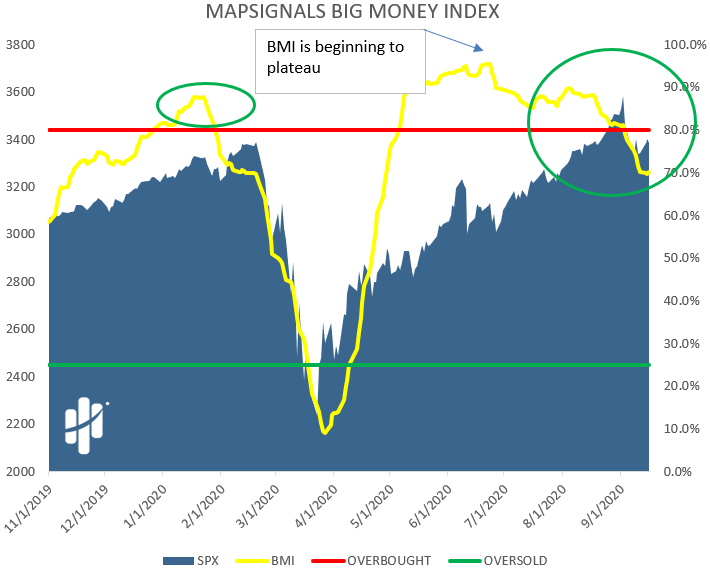
A soft BMI normally leads to lower market prices. And deteriorating market internals make weak hands easy to spot.

Our data indicates that this is a technical pullback. That means the market got overheated and needed to vent some steam. It’s natural, normal, and needed. That’s why we see this  as an opportunity as opposed to pain ahead.

A good flush-out tends to scare off new inexperienced money. Now is the time to have those buy lists ready.

Big Money ETF Action Quiets Down

Retail investors love ETFs. Retail is an individual, non-professional investor trading securities through a broker online or otherwise. When they plow in with conviction, stock markets tend to pullback soon after.

Ironically, just when “mom ‘n pop” investors feel it’s safe to get in, volatility comes like a bandit to steal their confidence away from them.

Since the big chunky ETF buying happened 2 weeks ago – buying has slowed dramatically:

big money ETF action quiets down

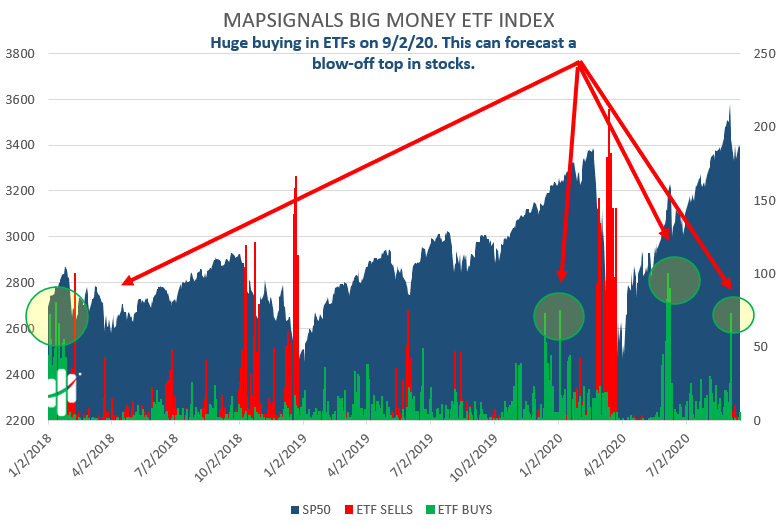
That’s right in line with what our data said last week in Summer’s Over. In other words, we expect choppy waters near-term.

And that’s good! We’ll be using this time to eye outlier stocks on sale. We’ll use the weak hands in the market to our advantage.

Weak Hands Equal Opportunity

When fear starts to grip a market or more specifically a sector, like Technology, prices can get out of whack quickly. Like an overbought market when both good and bad stocks go up, fear whacks both good and bad stocks. For us, that’s when things get interesting…when the bids fade.

When no one wants to buy is a blissful opportunity.

When times get tough, as an investor, you can choose to either strap on a helmet or hide your head in the sand. But, only one makes money over the long-run… significantly more than the other.

This reminds me of when we would experience volatile days when we worked on trading desks. Being salesmen, our job was to bring big order-flow to our traders. We would drum up the interest and our in-house traders would make a market… i.e. market-makers.

For example: we would be asked by a client for a price on five million shares of an obscure illiquid ETF. Our trader would have to show a bid, where s/he was comfortable to buy, and an offer at a comfortable sell level. Oddly enough, some traders loved volatility, and others loathed it.

Said another way, one trader would strap on a helmet, while another would clam up…the latter didn’t want the risk.

I’ll let you decide which trader made the most money year after year. Here’s a hint: it wasn’t the one with the weak hands.

Bottom line: fear will cost you long-term. Don’t let a little volatility bounce you out of great stocks. If you are sitting patiently, waiting to jump in, bravo! Take your time… there’s always opportunity.

When big sell-off days come, we like to pick our spots. We take pride in it. Afterall, the seller on the other side might be some poor weak hand that just got his confidence scorched.

When they are begging for the pain to stop, we wink and nod and happily alleviate their pain.

Call us stock anesthesiologists.

Weak hands in pain create great opportunities.

We’ll be ready…will you?

Lucas Downey
Lucas Downey

Lucas is co-founder of MAPsignals. His full bio can be found here.
Prior to MAP, he was Head of ETF Sales at Cantor Fitzgerald & SVP of Derivatives at Jefferies, LLC.

Spread the word!

Category: All, Big Money Insights Weekly, Special Reports

Previous Post: « Be In The 1% With Outlier Stocks – MoneyShow With Lucas Downey
Next Post: Election Trade ELECTION TRADE»

Reader Interactions

Comments

  1. Hill D.

    October 18, 2020 at 4:41 pm

    The most glaring problem for investors and traders is buying or selling at the very worst time. For example, when a bear market nears its end, the news is at its worst. Losses for those who held on as the market fell are at a maximum and fear becomes the driver in people s minds. However, valuations are likely to be cheap and charts might point out technical conditions conducive for buying, not selling. At this point, sentiment is at an extreme for bearishness and weak hands only see the fear. Conversely, strong hands see the opportunity. They know they can buy even if the price dips further because they have the resources to handle the drawdown .

    Reply

Leave a Reply Cancel reply

Your email address will not be published. Required fields are marked *

Primary Sidebar

Get Big Money Insights for FREE

Want to know where the Big Money is headed?

Just enter your email address below. You'll get our FREE NEWSLETTER sent directly to your inbox.

We call it Big Money Insights... It’s your weekly sneak peek at the powerful market-moving forces that are hidden from 99% of investors.

"*" indicates required fields

This field is for validation purposes and should be left unchanged.

Categories

  • All
  • Big Money Insights Weekly
  • Big Money Series
  • Macro Insights
  • MAP In The Media
  • Members Only
  • Performance
  • Podcast
  • Special Reports
  • Stocks
  • Videos & Interviews
  • White Papers

Archives

  • February 2023
  • January 2023
  • December 2022
  • November 2022
  • October 2022
  • September 2022
  • August 2022
  • July 2022
  • June 2022
  • May 2022
  • April 2022
  • March 2022
  • February 2022
  • January 2022
  • December 2021
  • November 2021
  • October 2021
  • September 2021
  • August 2021
  • July 2021
  • June 2021
  • May 2021
  • April 2021
  • March 2021
  • February 2021
  • January 2021
  • December 2020
  • November 2020
  • October 2020
  • September 2020
  • August 2020
  • July 2020
  • June 2020
  • May 2020
  • April 2020
  • March 2020
  • February 2020
  • January 2020
  • December 2019
  • November 2019
  • October 2019
  • September 2019
  • August 2019
  • July 2019
  • June 2019
  • May 2019
  • April 2019
  • March 2019
  • February 2019
  • January 2019
  • December 2018
  • November 2018
  • October 2018
  • September 2018
  • August 2018

Follow us on Twitter

MAPsignals Follow 1,434 1,061

MAPsignals is a data platform that tracks institutional money flows in stocks and ETFs. Sign up for free insights here: https://t.co/SaAVHjKC9J

mapsignals
mapsignals avatar; MAPsignals @mapsignals ·
55m 1621476848990359552

Pendulum has swung

Helene Meisler @hmeisler

Highest volume for the QQQs since 12/13

Reply on Twitter 1621476848990359552 Retweet on Twitter 1621476848990359552 0 Like on Twitter 1621476848990359552 0 Twitter 1621476848990359552
Load More...

Footer

© 2021 Mapsignals.com

  • Home
  • Contact & Disclaimer
  • Privacy Policy
  • Terms & Conditions
  • Opt-out preferences
  • FAQ

Copyright © 2023 · Mai Law Pro on Genesis Framework · WordPress · Log in

✕
What Happened to Risk Assets White Paper is Here

Get your copy here and take a journey through our thoughts on margin and leverage.

Enter your email address below and you'll get our FREE NEWSLETTER sent directly to your inbox. 

 We call it Big Money Insights... It’s your weekly sneak peek at the powerful market-moving forces that are hidden from 99% of investors.

MAPsignals
Manage Cookie Consent
We use cookies to optimize our website and our service.
Functional Always active
The technical storage or access is strictly necessary for the legitimate purpose of enabling the use of a specific service explicitly requested by the subscriber or user, or for the sole purpose of carrying out the transmission of a communication over an electronic communications network.
Preferences
The technical storage or access is necessary for the legitimate purpose of storing preferences that are not requested by the subscriber or user.
Statistics
The technical storage or access that is used exclusively for statistical purposes. The technical storage or access that is used exclusively for anonymous statistical purposes. Without a subpoena, voluntary compliance on the part of your Internet Service Provider, or additional records from a third party, information stored or retrieved for this purpose alone cannot usually be used to identify you.
Marketing
The technical storage or access is required to create user profiles to send advertising, or to track the user on a website or across several websites for similar marketing purposes.
Manage options Manage services Manage vendors Read more about these purposes
View preferences
{title} {title} {title}