Weakest Breadth Since October 2023
The equity meltdown continues.
Whipsaws are nauseating.
We’re witnessing the weakest breadth since October 2023.
Negativity is commonplace right now. Investors fear tariffs, the path of interest rates, inflation, DOGE, and more.
This cocktail of uncertainty has the crowd fearing for the worst.
I’m here to offer up a different more constructive view…one that’s grounded in evidence-rich data.
While I can’t argue the fact that equities are in a troublesome downtrend, what I can highlight are 2 glaring data-points that most miss right now:
- The latest selloff is on putrid volumes, indicating forced selling is not occurring
- Breadth has sunk to levels where betting against the crowd offers high odds of success
If you’re having difficulty finding a positive view, stay with me. Under-the-surface reveals a setup that rarely comes along.
Volumes are Low as Liquidations Have Stopped
Last week I wrote how ETF capitulation stopped.
That’s still the case. Below reveals this beautifully with our equity flow data.
Notice how we are seeing very few inflow/outflow signals the past week+:
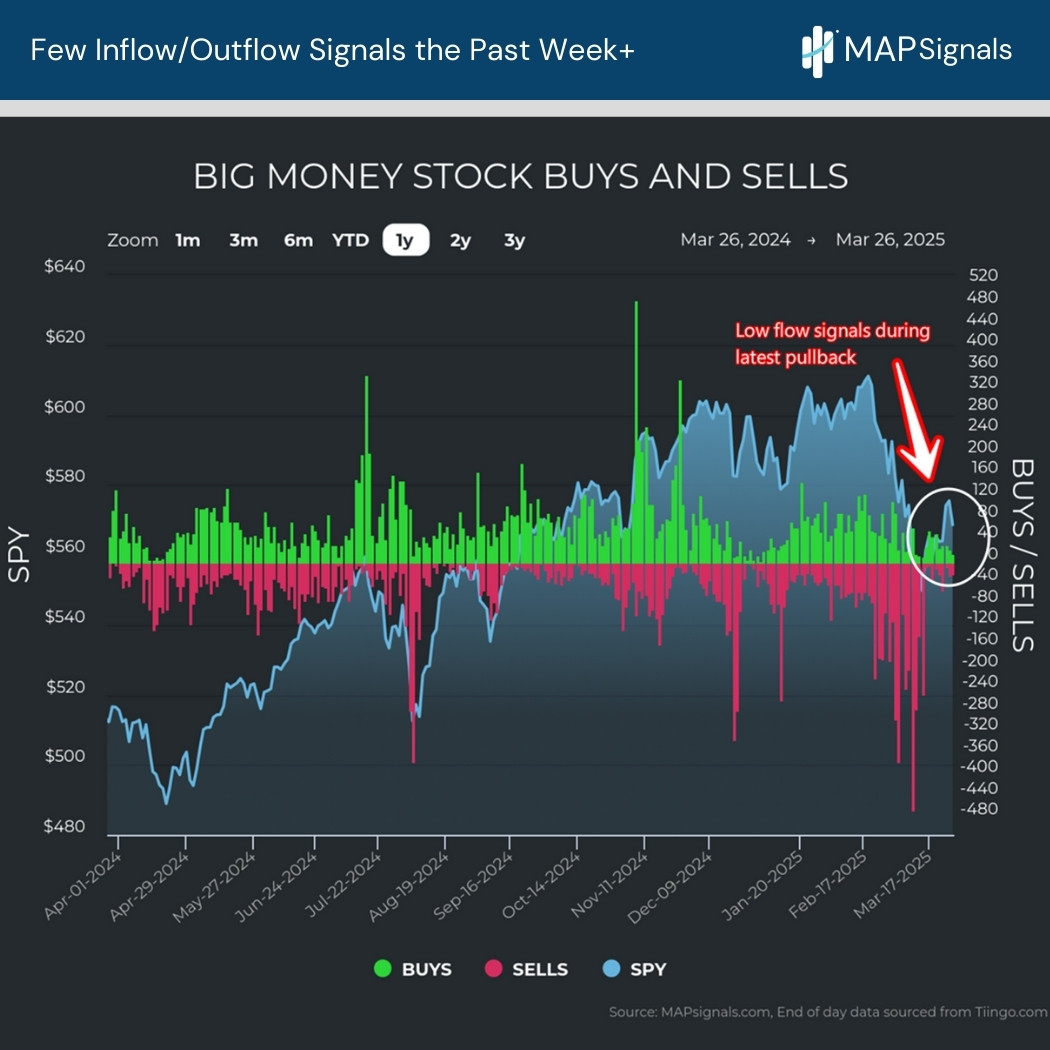
The reason for this collapse in signal count is simple: volumes have dried up since the capitulation event the week of March 10th.
One of the best ways to see volume magnitudes is with our Big Money Trading Activity chart.
This tallies up a daily count of stocks and ETFs trading on unusually large trading flows.
Look how this barometer has ground to a halt. In fact, yesterday March 26th returned the lowest daily count of Big Money Trading in 2025.
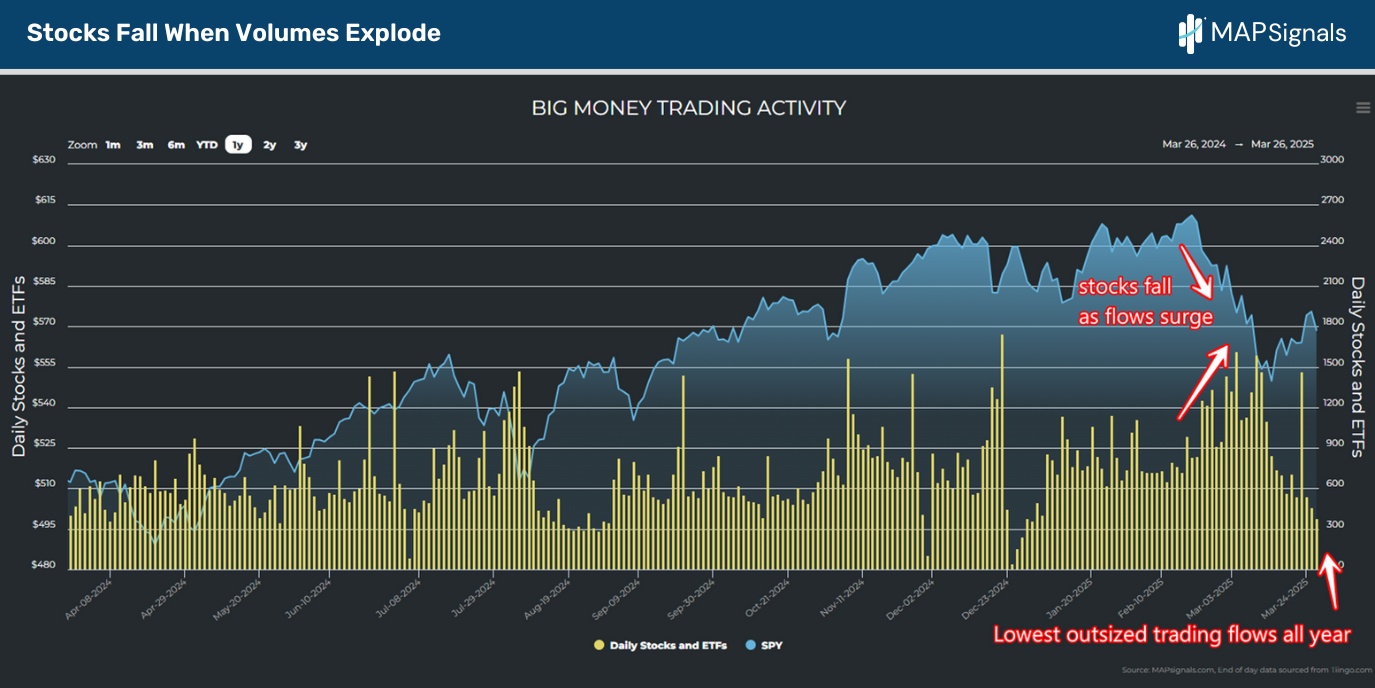
There has been a clear relationship in our data. Stocks fall when volumes explode.
On the flip side, equities stabilize as volumes drop.
The million-dollar question on everyone’s mind is this: Is this the calm before the storm?
Maybe.
Before you decide, let’s zoom in.
Sometimes you have to look backwards to see the future.
Weakest Breadth Since October 2023
Breadth reveals the health of the market. It tells us how strong the trends are under the surface.
We’re at the weakest reading in well over a year.
From February 20th – March 26th, we’ve had 1163 inflows vs 3559 outflows. If we take the inflow count (1163) and divide it into the total signal count of 4722 (1163 + 3559) we get a buy ratio of 24.6%.
We track many breadth readings internally…this one jumped off the chart this morning.
Below I’ve highlighted today’s situation and the last time when we saw a similar gauge back in October of 2023:
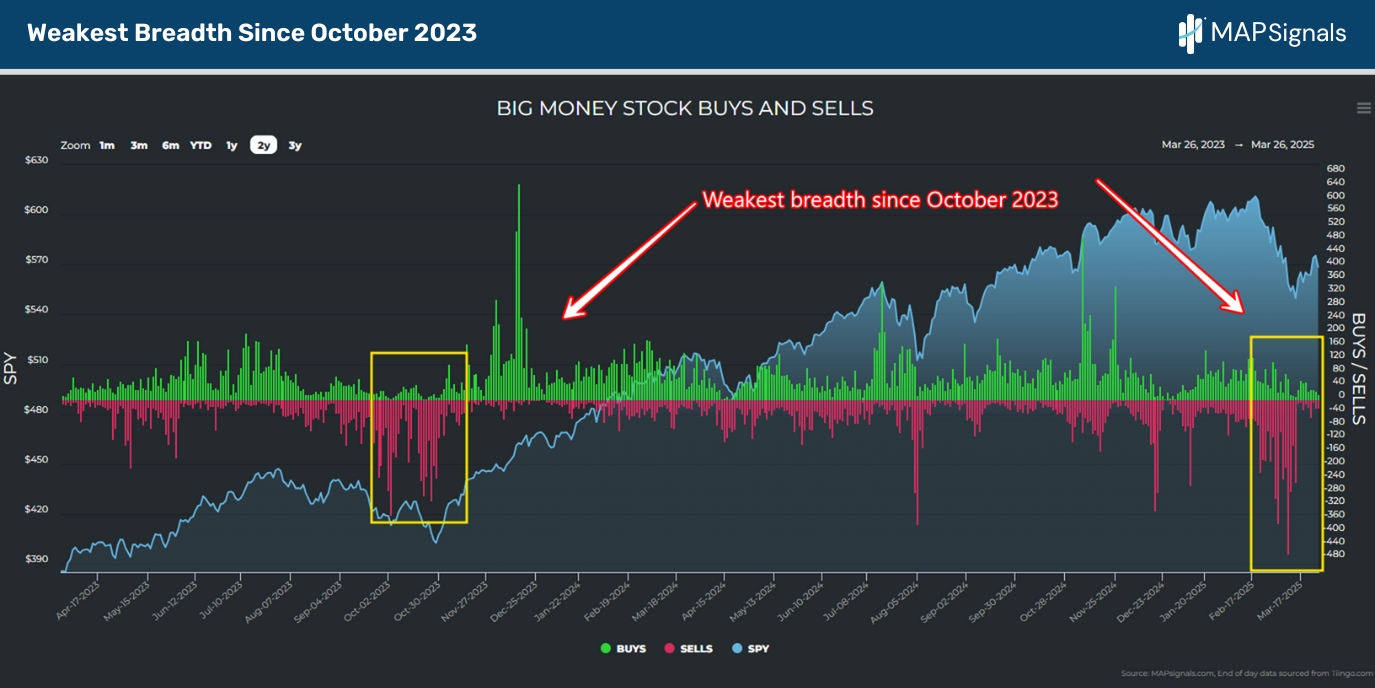
Speaking of October 2023, it’s easy to forget how fearful the crowd was back then. Most pundits warned of equity fire and brimstone.
We followed our data and told you 2 bear-killer signals are here.
It wasn’t popular at the time. But we aren’t in the popularity business. We’re in the evidence business.
Today we’ll be sharing another against-the-grain study that suggests monster upside is likely around the corner.
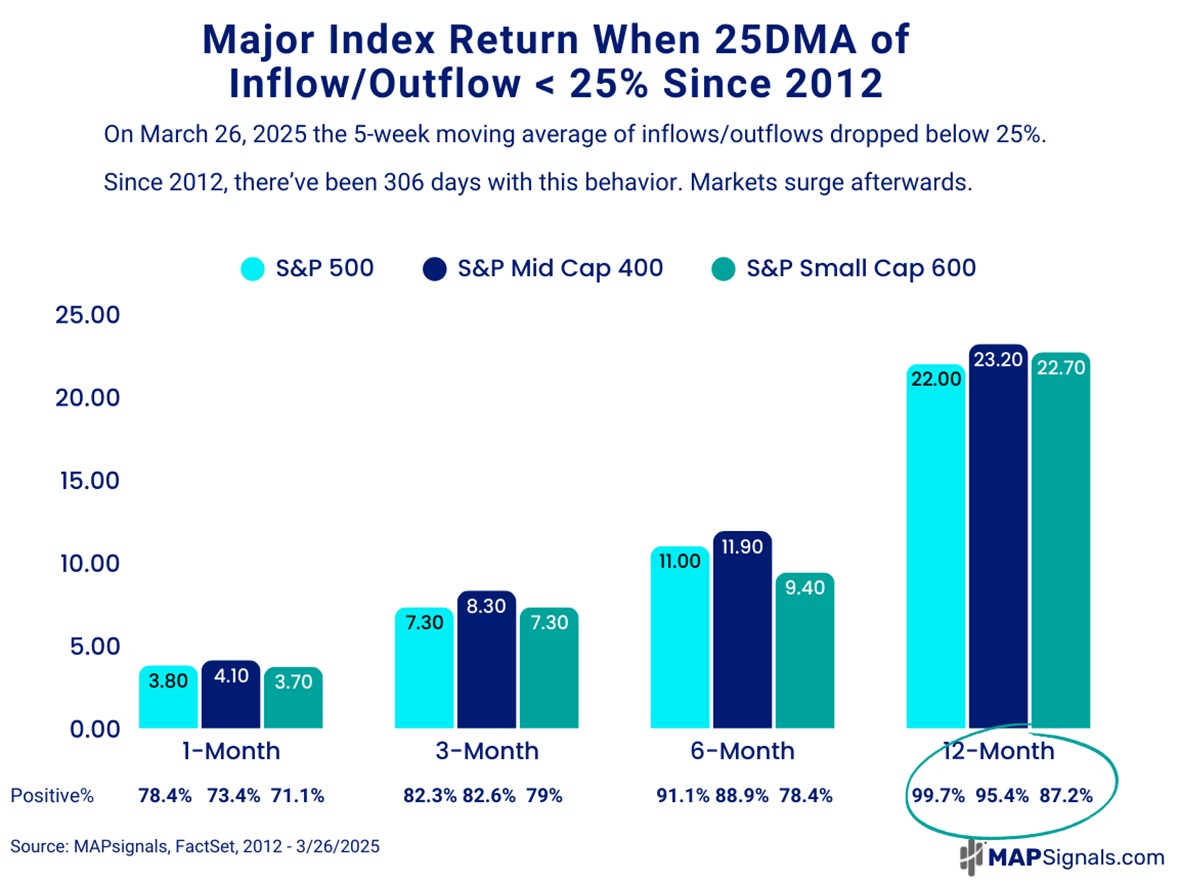
I went back and isolated all periods back to 2012 where our equity flow data registered a breadth reading of 25% or less.
I found 306 instances spanning the bear market of 2023, inflation pullback of 2022, COVID-19 crash, rate scare of 2018 and more.
Each of these periods were trying times.
More importantly they were buying times.
Below reveals the forward returns of the S&P 500, S&P Mid Cap 400, and S&P Small Cap 600 post all 306 signals:
- 3-months later all benchmarks climb 7%+
- 6-months later they ramp 9%+
- 12-months later the average gain is 22%+
Important to note, the S&P 500 has a positive hit ratio 12-months later of 99.7%. Only 1 single instance were stocks lower a year later:
It’s simple.
Breadth is extremely weak right now.
The common stance is to “sit this one out.”
Based on the evidence, we’ll take the other side.
Plenty of high-quality stocks are on sale, reaching levels that rarely hang around forever.
If you’re like me and want to take advantage of this rare event, earlier this week we put together a PRO update highlighting a great list of high-quality stocks being unfairly punished.
Don’t wait for the crowd to blow the bull whistle…by then you’ll have missed the deep discounts offered today.
Follow the money flows.
If you’re a serious investor, RIA, or money manager – right now is a wonderful time to sign up for our PRO service. You’ll see cutting edge research offering a data-driven outlook.
Breadth is extremely weak right now.
Take advantage of it!
Lastly, join me April 10th at 10am ET at the Wealth365 Summit – as I present: Using Money Flows to Forecast the Best Stock Performers in 2025. It’s virtual and free!
You won’t want to miss it.