
What Goes Up Keeps Going Up
I’m sure you’ve heard the saying: “what goes up, must come down.”
But at MAPsignals we like to say “what goes up keeps going up.”
Why? Because that’s what tends to happen with outlier stocks over long timeframes. The best of the best go up.
By now, you should know we love when outlier stocks keep breaking new highs. But there’s a little secret we’ll let you in on…if you’re in an outlier, that’s what you should expect year after year.
But what about when all stocks are busting to new heights and not just the best ones? Right now, stock pickers must be beside themselves as they watch all stocks fly high.
Of course, this isn’t new; markets get frothy sometimes. Greed inevitably prevails and buying becomes unsustainable. Annoyingly, stock prices can defy logic for a long time.
So, what are we supposed to do when everything screams higher every day? What goes up must come down, right?
At MAPsignals as always, we analyze data. Only when the buying trend shifts can we expect anything different. Until then it’s business as usual. A very successful trader once said: “the trend is your friend until it bends.”
Surfing the market is like surfing waves. On a wave, surfers know it will eventually crest. But she doesn’t jump off early trying to anticipate the end of it. She keeps surfing as long as she can.
Stocks are no different. We know buying can’t continue like this forever, but what we don’t know is precisely when it will end. As we saw for 4 months last summer, markets can remain overbought longer than logic says is possible. That’s why we respect the narrative of data.
As Big Money surges into stocks day after day, most brokerage accounts head higher.
Until this wave crests, enjoy the ride! That’s what we’re doing.
For now, what goes up keeps going up…until it doesn’t.
Big Money Index Hovers High
There is a flood of Big Money gushing into stocks. Sellers are nowhere to be seen. When this happens, we usually ask each-other here: “where did all the bears go?”
The Big Money Index has flatlined for weeks:
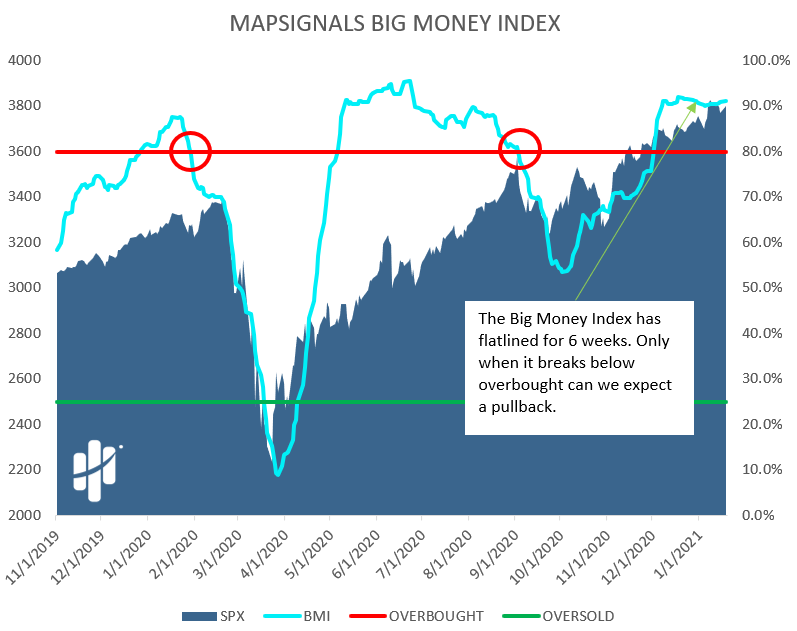
The red circles above show what we are focusing on. When the BMI falls out of overbought, a pullback is likely near. In other words, what goes up keeps going up, until the BMI starts falling.
We believe that because history has shown it to be true. Time and time again, this indicator has sniffed out trouble before turbulence hits.
The Big Money Index is like our stock market radar. For now, signs keep pointing to higher prices.
Let’s drill down.
Daily Stock Buying Is Strong
The BMI is created using the 25-day moving average of all Big Money buy and sell signals. Times like now, where the BMI shows no signs of weakness, we would expect stocks to continually show green.
And they do. So, for the past few months the mantra has been: what goes up…keeps going up. Have a look at the monster buying since election day:
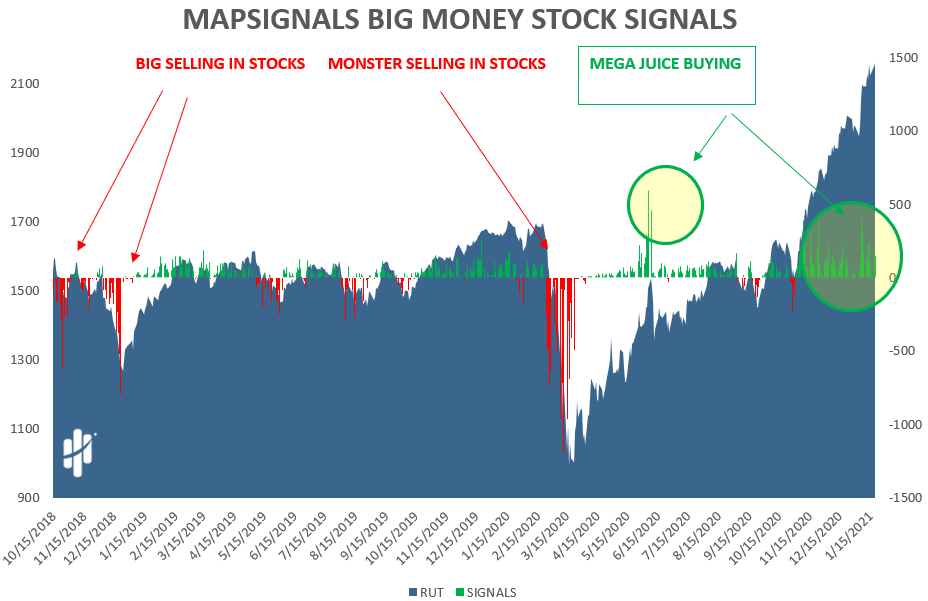
The magnitude of buying is breathtaking. Let’s zoom in:
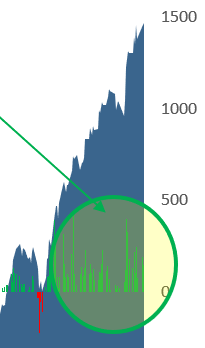
What we see, and what you should see, we describe in one word: JUICE.
Now, let’s keep drilling down. Which sectors are the Big Money rushing into?
What Goes Up Keeps Going Up By Sector
Certain sectors get more love than others. This is important because year-to-date, 95% of all stock signals have been buys. But that doesn’t mean all sectors are created equally in the eyes of those buyers.
Here, we’ve broken down all of those 2239 signals since New Year’s by sector:
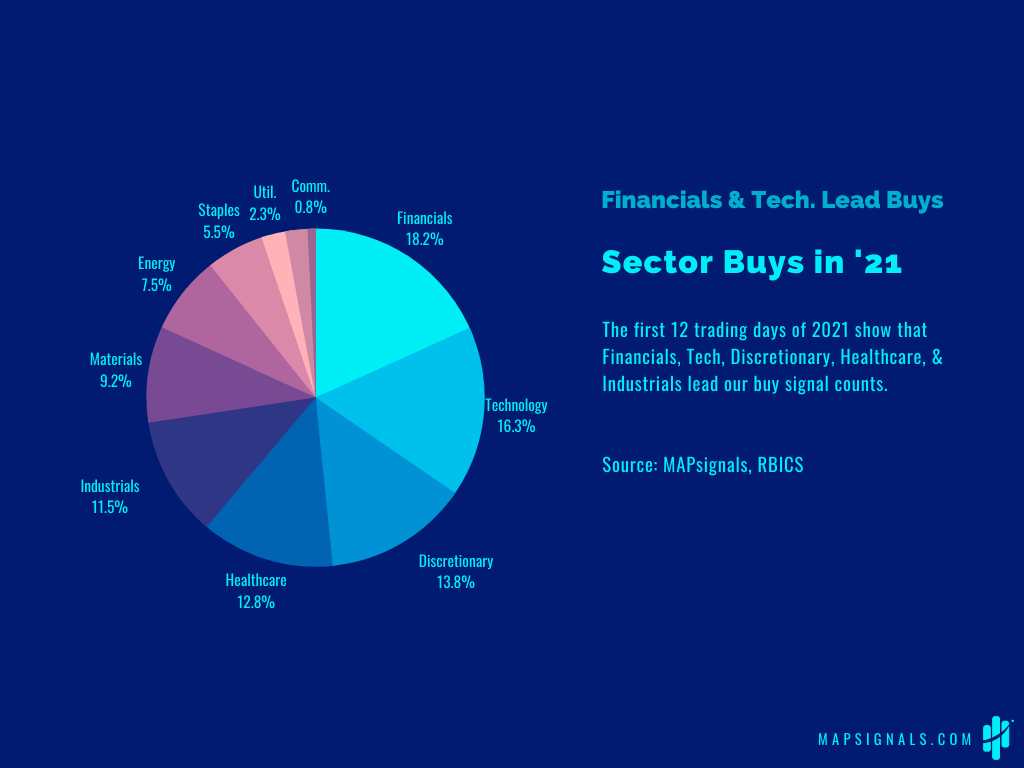
We notice one clear difference from last year. While Tech is still a big capital magnet, so far it’s sharing the spotlight this year. The top magnets for capital have been: Financials, Technology, Discretionary, Healthcare, & Industrials.
Looking at all of the signal counts gives us a broad idea of money flows, but not the full picture. Each week, in our MAP View report we measure sector turnover of Big Money. We do this by dividing the sector universe of liquid stocks, by total buy and sell signals on the week.
For example, seeing 210 buy signals out of 210 Financials stocks in a given week means 100% of the universe was bought.
This method shows us buying strength relative to each sector’s size. Below in yellow, we flag sectors seeing >25% of their universe bought with Big Money (there were no yellow sector sell flags).
Trading week January 11th – 15th:
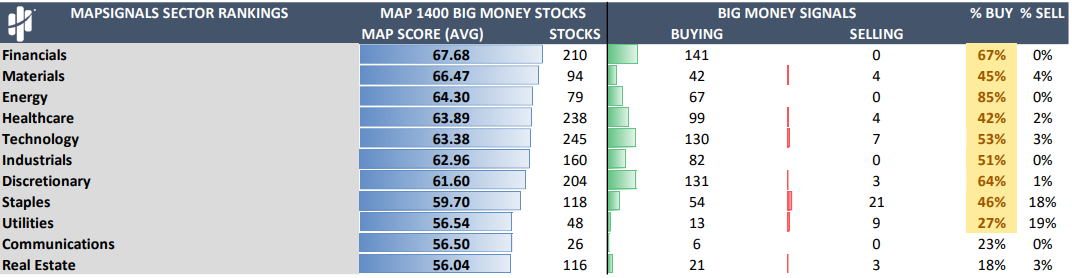
Source: MAPsignals, RBICS
As you can see, all sectors except Communications and Real Estate saw notable buying.
Here’s the trading week of January 4th – 8th:
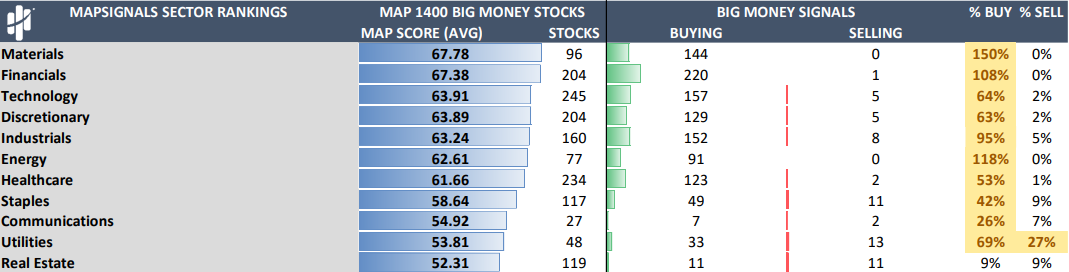
Source: MAPsignals, RBICS
Not only do we look at sector turnover, but we rank all of those sector signals by score. Financials and Materials have been the stars so far. Notice how Materials says 150%? That’s because some stocks are bought multiple days in a row and are counted multiple times.
Now that’s big buying when a sector sees more than 100% in a week.
Apparently, what goes up…keeps going up!
Here’s the bottom line: we’ve witnessed extreme buying for months now. The juice just doesn’t want to stop. And while the average of our 30+ year dataset suggested a top likely coming on January 19th, clearly stocks didn’t get the message…yet. They want the party to continue.
We’ve said it before, and we’ll say again: for great stocks over time- TAGU. They All Go Up.
In this big-bull environment, wealth is being created at a shocking pace. Hopefully your accounts are participating!
Alas, we know buying like this can’t last forever. We all know what goes up must come down. But at MAPsignals, we religiously respect the narrative of data. For now, it says: what goes up keeps going up
…until it doesn’t.