• Menu
  • Skip to right header navigation
  • Skip to main content
  • Skip to primary sidebar
  • Skip to footer

MAPsignals

We map big money.

  • Latest Insights
  • Power of MAP
    • MAP Products
    • MAP System
    • MAP White Papers
    • Videos & Interviews
  • Profit with MAP
  • About
    • About MAP
    • MAP Team
    • Authors
    • MAP System
    • MAP Products
    • Big Money Index
  • Members
    • Get Started With MAP
    • My MAP
    • Big Money Charts
    • MAP View
    • MAP View Options
    • MAP Top 20 Weekly
    • MAP 50
    • Member Updates
    • Platinum Updates
    • Members Only Posts
    • Performance
  • Portal

When Will Stocks Pullback

April 29, 2021 //  by Lucas Downey//  13 Comments

Investors always want to know, “when will stocks pullback?”

We all know nothing is guaranteed. But today I’ll show you my most reliable way to prepare for the inevitable.

(Plus a HUGE announcement!)

WHEN WILL STOCKS PULLBACK

Let me be crystal clear: our data is NOT signaling a pullback. As I’ll show you, it’s actually quite positive right now. So, we’re not changing our tune from the past few weeks.

MAPsignals data is lining up with our prior bullish thesis. Soon, I’ll walk you through some very encouraging signs for higher stock prices. Yet, it would be foolish to pretend the party won’t eventually end.

But we have great news for you: Subscribers can now be better prepared than ever before! And that’s what we’re about to announce…

But before we do, we need to check in on the stock market which is setting up for more juicy highs.

Big Money Index Says Up Up And Away

We’ve been bullish for weeks.  Because when there is no selling in our data, we expect higher prices.

Earlier this month we discussed how stock buyers tend to show up gradually, then suddenly. Here at MAPsignals, we’re all about taking our cues from the Big Money Index. Then we work our way down.

Let’s do that right now. The BMI is ramping…

big money index

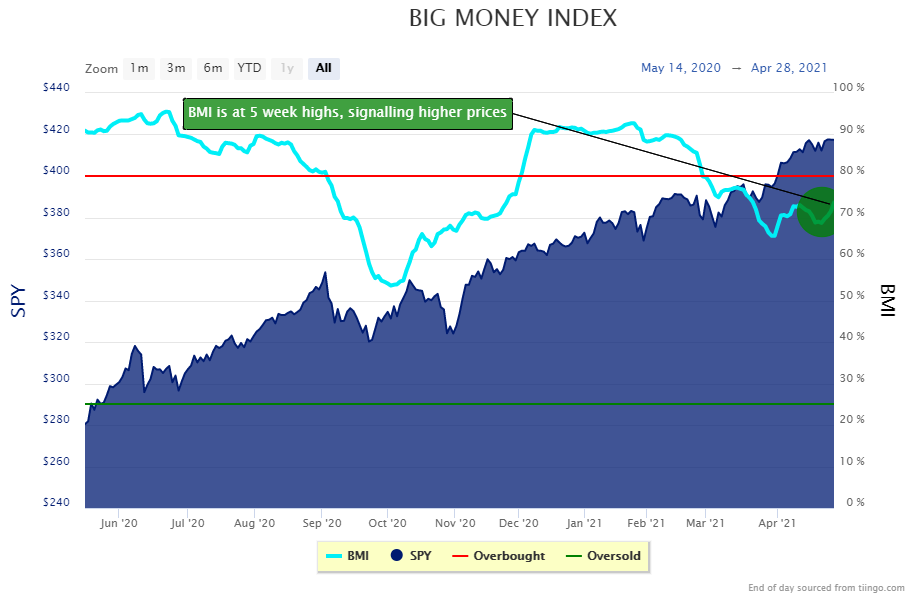
Off to the right, I’ve circled what’s important: The BMI is at the highest levels in over 5 weeks. The momentum of buying is accelerating on margin.

Look– that alone tells me all I need to know: Prepare for JUICE! Naturally you may want to know when stocks will pullback, but based on the Big Money Index chart, today is not the day.

Let’s keep drilling down. That Big Money Index is composed of daily stock buys and sells. We’ve been preaching for weeks how earnings season often brings the buyers.

If Paul Revere were a data analyst, he probably would’ve said: “The buyers are coming! The buyers are coming!”

Here’s why: Below we see our Big Money Stock Buys & Sells chart. This is essentially what the BMI turns into a moving average to see money-flow trends. And following that trend is key. Leading up to earnings season, stocks are usually quiet. Then as things start rolling, buyers show up.

That’s what’s happening right now, as if on cue:

big money stock buys and sells

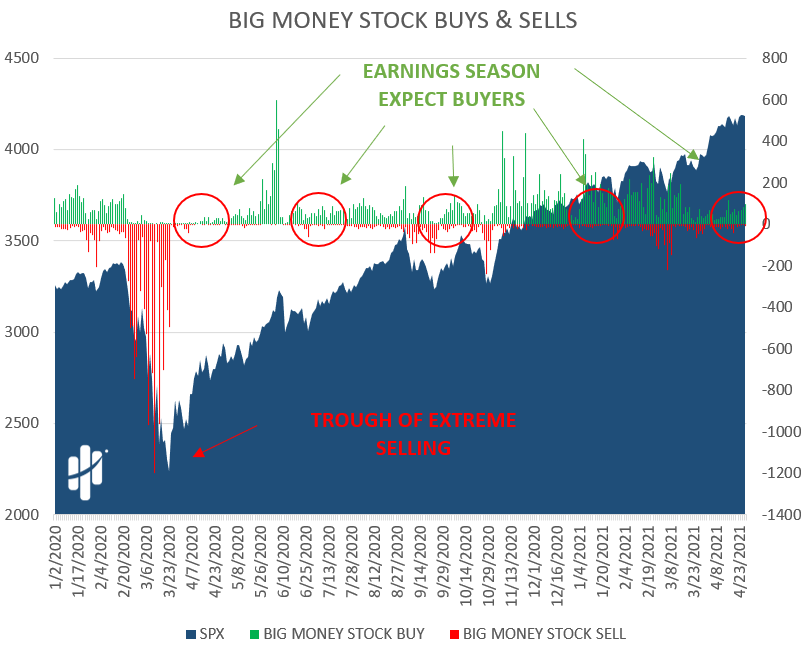
We circled earnings season above to make it clear. Buyers tend to accelerate as solid earnings reports roll in.

I know what you are going to say: ”That’s great and all, but when will stocks pullback?”

Again, sorry to say, according to this chart, it is not today.

But let’s keep going.

ETF Buying Holds Steady

We see the Big Money Index is racing higher because stock buying is increasing. But what about ETFs?

Usually, they follow stock action. Right now, buyers are stepping into ETFs, too.

Like the chart above, this one shows the daily buys and sells of ETFs. Make no mistake: This is a powerful indicator of what is going on under the surface.

etf buys and sells

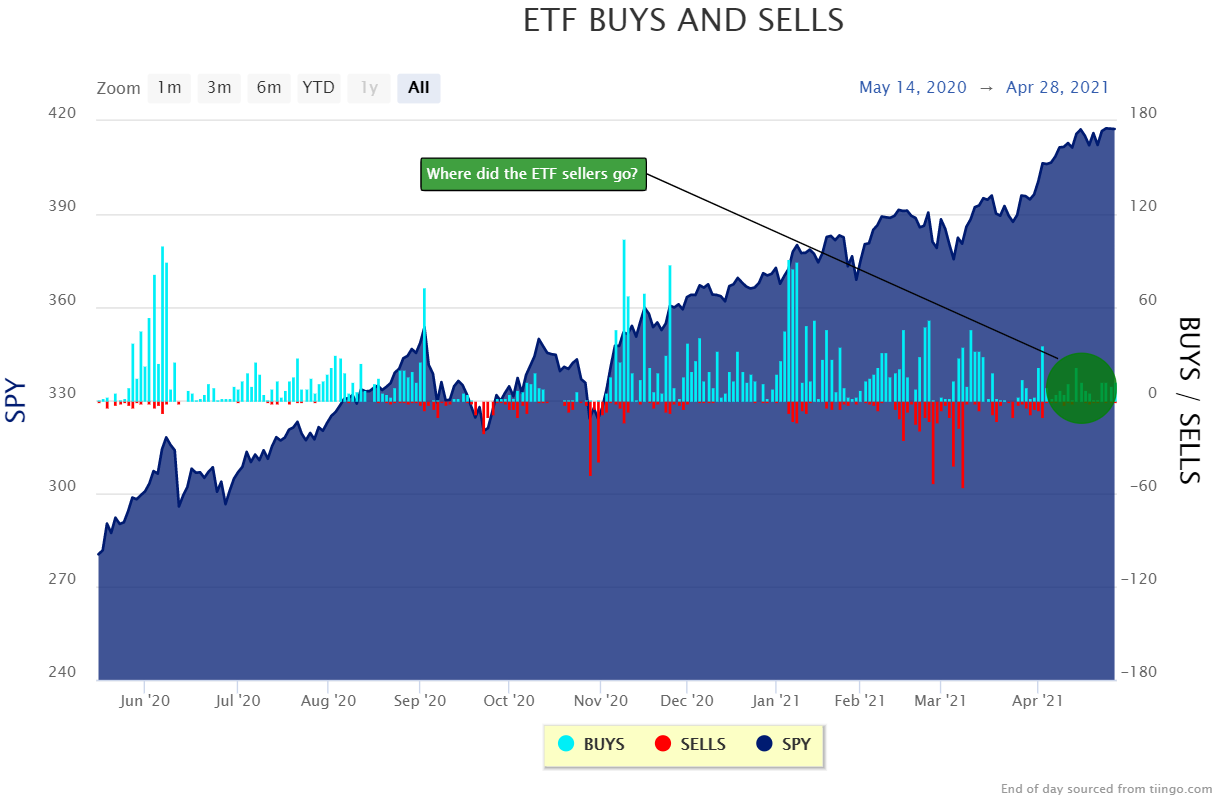
Off to the right you can see that buyers are steady (blue). More importantly, there is no selling (red). To us, this data is bullish.

Again, I’m sure you’re wondering: “when will stocks pullback?”

But looking at this MAPsignals ETF chart, it’s not today…

Which brings me to the biggest announcement MAPsignals has made yet.

When Will Stocks Pullback, Follow The Big Money Index Yourself

Starting today, MAPsignals subscribers now have access to the first and third charts you see above: The Big Money Index & our ETF Buys & Sells. Only, these update early every morning automatically. You can log in and hover your pointer over them to get the values. This way, you don’t need to wait for us to tell you… you can check it yourself usually by 6AM ET every day!

Members of all subscription levels can access them here.

This was hands down your biggest request. You wanted on-demand access to our most popular charts. They are finally here.

As we always find a hidden story in data, there is a hidden story in this announcement too: This is just a first glimpse of what’s to come.

In the coming months we will roll out more functionalities including access to on-demand stock analysis on over 5,000 stocks the MAPsignals way, back-testing our outlier stocks as baskets, and other exciting interactions with our data.

Soon, you’ll be able to “choose your own adventure.”  As we work on those other new functions, these two are perfect to start us off!

So, if you’re new to MAPsignals and want to get your feet wet with our data, now you can! And if you’re still sitting on the fence, there’s never been a better time to join us. There is no better way to navigate the market than using a MAP!

Here’s the bottom line: Multiple data points say stocks are headed higher. The Big Money Index is gaining ground, stock buying is ramping, and ETFs are seeing the juice, too.

Near-term we expect more highs, but we all know it won’t last forever. So, let me answer the all-important question: When will stocks pullback?

Unfortunately, I can’t say for certain, but what I can say is Big Money often gives us a heads-up beforehand. And that’s why today’s announcement is so powerful. Because generally the BMI starts falling well in advance of market pullbacks. And ETFs show that extreme buying days, signal near-term tops!

These two powerful indicators are now in your hands if you are a MAPsignals subscriber.

And nothing makes us happier!

If you’re not yet a subscriber and want access to our awesome charts, get started here!

***As a bonus, our latest video series are here: Best Growth Stocks May 2021 & Best Dividend Stocks May 2021.

Check them out!

Lucas Downey
Lucas Downey

Lucas is co-founder of MAPsignals. His full bio can be found here.
Prior to MAP, he was Head of ETF Sales at Cantor Fitzgerald & SVP of Derivatives at Jefferies, LLC.

Spread the word!

Category: All, Big Money Insights Weekly

Previous Post: «best dividend stocks may 2021 Best Dividend Stocks May 2021
Next Post: Big Money Index Flashing Red? big money index flashing red»

Reader Interactions

Comments

  1. Kamran

    April 29, 2021 at 11:38 am

    what was the HUGE announcement?

    Reply
    • MAPsignals Staff

      April 29, 2021 at 11:44 am

      Members can now track the BMI and ETF flows on a daily basis!!

      Reply
  2. Map subscriber

    April 29, 2021 at 12:00 pm

    So, the HUGE announcement still needs a PAID subscription as a pre-requisite ?
    Nothing for newsletter subscribers ?

    Reply
    • MAPsignals Staff

      April 29, 2021 at 12:04 pm

      Yes for now – that’s what our paying subscribers have been asking for. So, to us that’s a big accomplishment -and worth telling people about.

      Reply
      • Lorenzo

        April 29, 2021 at 12:15 pm

        Don’t listen to those people, your analysis is great and offers so much value even for the free stuff.

        Keep up the good work!

        Reply
        • MAPsignals Staff

          April 29, 2021 at 12:30 pm

          Thank you! These updates take months to create. It’s a labor of love 🙂

          Reply
      • Jon H

        April 29, 2021 at 1:04 pm

        Thanks for the big announcement, I plan to re subscribe specifically for this data, very exciting!! If there is a way to have routine views for major sections of the market (such as real estate) that would be fantastic also.

        Reply
        • MAPsignals Staff

          April 29, 2021 at 1:14 pm

          Great thoughts right there – eventually you’ll be able to do that!

          Reply
  3. Joe

    April 29, 2021 at 12:11 pm

    Q: When will the stocks pull back?

    A: Well it’s a no brainer…….When the Fed stumbles. Looks like they are standing on noodle legs.

    Reply
  4. james

    April 29, 2021 at 2:48 pm

    I’m not a stock/etf investor; I use ProFunds for their flexibility and no fees for unlimited changes like most fund families. However, I do appreciate good timing services and I find your MAP system helpful. Much as I’d welcome a daily update, paying for a stock picking service just isn’t worth it to me. How about offering an affordable daily service for people like me?

    Keep up your good work.
    Jim

    Reply
    • MAPsignals Staff

      April 29, 2021 at 3:49 pm

      Hey Jim –

      Eventually we’ll probably do something daily. We’d just need to hear from people that it’s what they want.

      Maybe a Daily Market MAP 🙂

      Reply
  5. VJSpini

    April 29, 2021 at 2:56 pm

    Fantastic, great charts, MGI, is the true path.

    Reply
  6. James B

    April 29, 2021 at 6:01 pm

    I’m with Jo.
    The fed has not released the CPI-W for March. It’s almost May! They have yet to pay the most honest 2020 tax refunds from February! They have earmarked another trillion for nothing.
    Commodities are through the roof: corn is near $7/bushel, building materials so high houses aren’t being built. Existing home prices crazy high if You can find one! Gasoline/diesil up nearly 40%. And promised higher taxes from current regime.
    The Shiller ratios are straight up! Broad market earnings can’t correct them.
    Crypto currencies under new microscope with fed licking chops to FDR gold/silver for their own crypto.
    Short term, great. Get Your profits soon.

    Reply

Leave a Reply Cancel reply

Your email address will not be published. Required fields are marked *

Primary Sidebar

Get Big Money Insights for FREE

Want to know where the Big Money is headed?

Just enter your email address below. You'll get our FREE NEWSLETTER sent directly to your inbox.

We call it Big Money Insights... It’s your weekly sneak peek at the powerful market-moving forces that are hidden from 99% of investors.

"*" indicates required fields

This field is for validation purposes and should be left unchanged.

Categories

  • All
  • Big Money Insights Weekly
  • Big Money Series
  • Macro Insights
  • MAP In The Media
  • Members Only
  • Performance
  • Podcast
  • Special Reports
  • Stocks
  • Videos & Interviews
  • White Papers

Archives

  • February 2023
  • January 2023
  • December 2022
  • November 2022
  • October 2022
  • September 2022
  • August 2022
  • July 2022
  • June 2022
  • May 2022
  • April 2022
  • March 2022
  • February 2022
  • January 2022
  • December 2021
  • November 2021
  • October 2021
  • September 2021
  • August 2021
  • July 2021
  • June 2021
  • May 2021
  • April 2021
  • March 2021
  • February 2021
  • January 2021
  • December 2020
  • November 2020
  • October 2020
  • September 2020
  • August 2020
  • July 2020
  • June 2020
  • May 2020
  • April 2020
  • March 2020
  • February 2020
  • January 2020
  • December 2019
  • November 2019
  • October 2019
  • September 2019
  • August 2019
  • July 2019
  • June 2019
  • May 2019
  • April 2019
  • March 2019
  • February 2019
  • January 2019
  • December 2018
  • November 2018
  • October 2018
  • September 2018
  • August 2018

Follow us on Twitter

MAPsignals Follow 1,449 1,070

MAPsignals is a data platform that tracks institutional money flows in stocks and ETFs. Sign up for free insights here: https://t.co/SaAVHjKC9J

mapsignals
mapsignals avatar; MAPsignals @mapsignals ·
9h 1622987016957820928

One of my favorite #dividend #stocks having a day - Skyworks Solutions $SWKS - owned it for years

The $2B buyback is pretty significant given the market cap is sub $19B

#Semiconductors continue to see major inflows

Reply on Twitter 1622987016957820928 Retweet on Twitter 1622987016957820928 0 Like on Twitter 1622987016957820928 2 Twitter 1622987016957820928
Load More...

Footer

© 2021 Mapsignals.com

  • Home
  • Contact & Disclaimer
  • Privacy Policy
  • Terms & Conditions
  • Opt-out preferences
  • FAQ

Copyright © 2023 · Mai Law Pro on Genesis Framework · WordPress · Log in

✕
What Happened to Risk Assets White Paper is Here

Get your copy here and take a journey through our thoughts on margin and leverage.

Enter your email address below and you'll get our FREE NEWSLETTER sent directly to your inbox. 

 We call it Big Money Insights... It’s your weekly sneak peek at the powerful market-moving forces that are hidden from 99% of investors.