
Which Stocks Do I Buy
When markets get rocky like now, make a plan. Because some of the best investing opportunities appear in a sea of red.
And when there’s red, scared investors scramble to decide which stocks to sell. But smart investors ask, “which stocks do I buy?” We have an answer for you and right now, we’ll show you how we do it.
We’ve said it before and we’ll say it again, summers are notoriously volatile for stocks, especially August. Liquidity dries up, stocks whip around, and pain can often be felt in your portfolio.
And while that may sound like something you’d like to avoid, the truth is some of the best stock grabs come when markets pullback. So, it’s crucial to keep a cool head and know what to do ahead of time.
We’d suggest making a buy list now. That way, if and when markets get ugly, you’ll have done your homework already. That way you can confidently ask yourself not which stocks to sell but instead: “which stocks do I buy.”
I’ll show you how we do that in a moment. But before I do, I want to discuss the state of the market. Major market indexes like the S&P 500 and Dow Jones Industrial Average are at all-time highs. But, behind the curtain we see that’s simply because a handful stocks are holding them up.
Many other stocks are floundering. Portfolios loaded with high-growth stocks are heavy. That’s an indication telling us to prepare for near-term downside.
But as always, we go by data which makes it clear to see.
Big Money Index Is At 18-Month Low
On the surface, everything appears healthy for stocks. Afterall, major maker indexes are at all-time highs. But, MAPsignals data tells a different story.
The Big Money Index has been falling for well over a month. And when it does, usually it means that selling is picking up. Historically, the BMI moves ahead of the market. That’s why we expect a near-term pullback soon.
The BMI is sitting at an 18-month low:
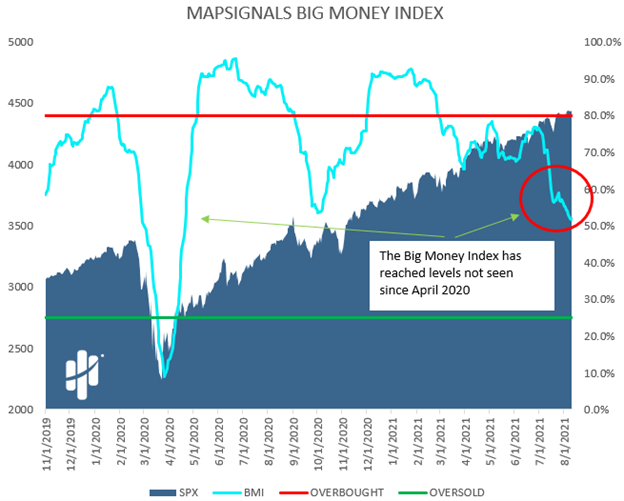
Just this week it fell below October’s low. For the BMI to fall like this, stocks either have to see a pickup in selling or a slowdown in buying. Right now, we are observing both.
A great way to see this is to look at our Big Money Stock Buys & Sells Chart. There’s a massive divergence happening with stocks:
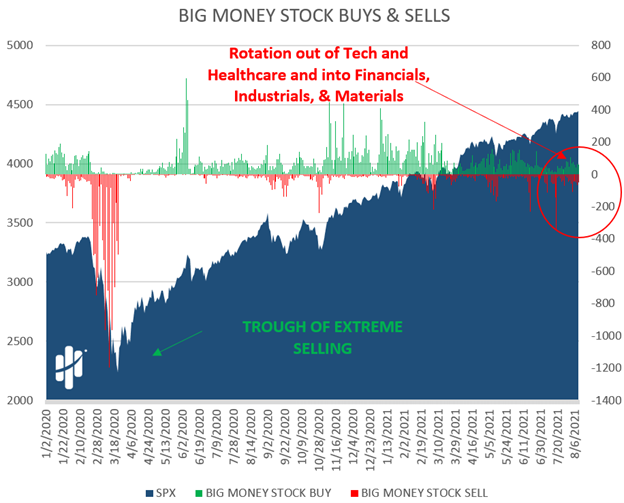
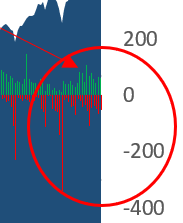
Over a 5-week period, selling has been steadily picking up. Here’s a zoom in:
And ETFs see the same patterns:
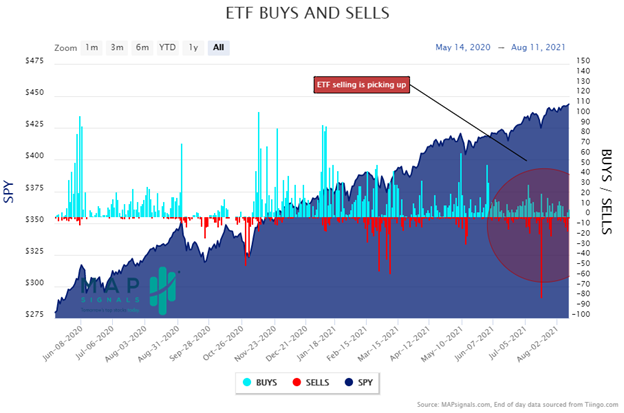
So, should investors worry about all the new selling? Actually, no you shouldn’t. Believe it or not, enough selling in stocks eventually becomes a strong buy signal: a contra-indicator. Let me show you what I mean.
Notice the big red bars in the ETF chart above? Those are monster ETF sell days. And that’s normally when the retail crowd dumps their stocks and runs for the hills.
But here’s the deal: when there’s peak selling…something extraordinary tends to happen – and we call it juice because stocks tend to jump after an ETF dump.
Since the pandemic lows in March 2020, here are the 2-week returns for the SPY (S&P 500 Tracking ETF) after nasty ETF sell days:
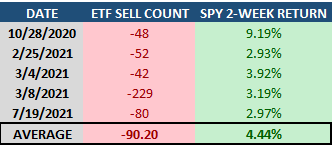
That’s mega-juice! Our subscribers can follow the daily ETF buys and sells here. If you’re not yet a subscriber and want more info- click here.
Whether the market will fall today, tomorrow, or next week- nobody knows. But MAPsignals data points to near-term pain coming.
Near-term pain means opportunity for long-term investors.
So, Which Stocks Do I Buy?
MAPsignals uses its own data to find the best stocks getting bought by Big Money. That’s how we find outliers: the stocks that trounce markets over long periods of time.
We get asked all the time: “which stocks do I buy?” Please know that we can never give personalized advice, but we can show how we build a buy list.
We’ve found that the stocks getting bought the most usually have somewhere else to be…and that’s higher. Each month we build our MAP 50 list. It’s the list of stocks seeing the most buy signals over a rolling 6-month period.
You can see a free example here, when we started releasing this report. Don’t be fooled thinking “it’s just an old list” because there are plenty of awesome stocks on it. For us, it’s a great place to start seeding a buy list.
So, if market shenanigans are causing you concern, slow down and make a plan. We use data as our guiding light. When we ask ourselves: “which stocks should I buy”, we’re searching for prior Big Money gems on a pullback.
And if this sounds like it’s up your alley, you can too!
Let’s wrap this up.
Here’s the bottom line: many stocks are under pressure (even the great ones) and there’s likely more to come. Historically, when stocks and ETFs get sold hard, stocks rally soon after. Our data signals redder days on the horizon.
But, don’t fret, simply arm yourself with a buy list now. Don’t ask yourself which stocks to sell. Also don’t wait until the last minute to ask yourself: which stocks do I buy? We suggest that you start your homework now.
My 10th grade teacher used to say the 5 Ps: Proper planning prevents poor performance.
That’s great advice and it has served me well over the years, so thank you Mrs. Corwin!
Don’t forget to check out our latest video: Best Growth Stocks for September 2021. Luke shows off some OG outliers in this one that might be worthy of consideration on your buy list homework!
Enjoy…
Make sure to like and subscribe to our YouTube channel!