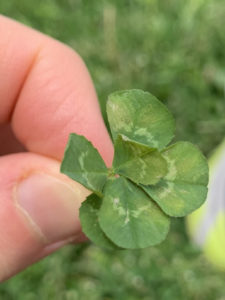
• Menu
  • Skip to right header navigation
  • Skip to main content
  • Skip to primary sidebar
  • Skip to footer

MAPsignals

We map big money.

  • Latest Insights
  • Power of MAP
    • MAP Products
    • MAP System
    • MAP White Papers
    • Videos & Interviews
  • Profit with MAP
  • About
    • About MAP
    • MAP Team
    • Authors
    • MAP System
    • MAP Products
    • Big Money Index
  • Members
    • Get Started With MAP
    • My MAP
    • Big Money Charts
    • MAP View
    • MAP View Options
    • MAP Top 20 Weekly
    • MAP 50
    • Member Updates
    • Platinum Updates
    • Members Only Posts
    • Performance
  • Portal

6 Leaf Clover

May 28, 2020 //  by Lucas Downey//  11 Comments

My kids and I searched for 4 leaf clovers for weeks but came up empty.

Suddenly, we found our first one.

Then another.

We got good at sifting through fields of clovers…uncovering the hidden.

Looking for outlier stocks is a lot like our clover hunt.

The search for the seemingly one-in-a-million is worth it when it pays off.

Those stocks are hidden in the fields of thousands of others.

Once in a blue moon, something really stands out…like this 6 leaf clover we found:

6 leaf clover

But finding the rare gem hidden in the vast field doesn’t only apply to finding the stocks of tomorrow.

Looking at the market as a whole can be just like an endless field of clovers.

Since the crash, the past couple of months, the field looks like an endless patch of monotony.

Looking day after day, eventually, an irregularity shows up offering new perspective.

And this week – things got interesting… we’re noticing that big buyers appear to be stepping in. The level of big buying in stocks is increasing rapidly. We expect this after a washout like in March. But now that it’s finally coming, it’s a change.

It’s what’s been missing in this rally. It’s the missing 4 and 6 leaf clover.

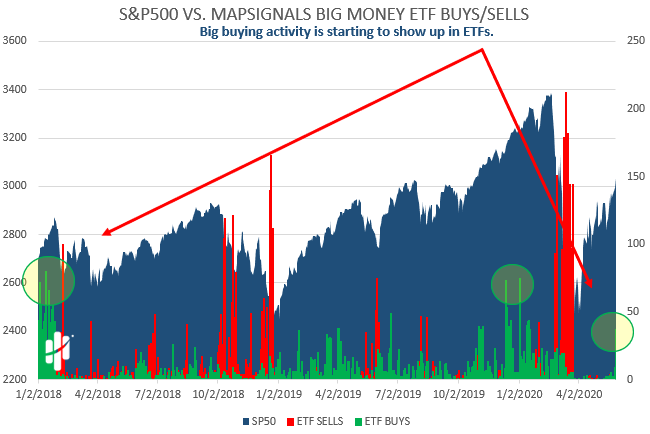
ETF Buying Is Picking Up

A few weeks ago we went overbought, not uncommon after a deeply oversold market. That causes us to pay attention. The Big Money Index helps alert us to change. Remember we wrote how, the big money index is dropping a dime?

We told you the overbought market was more technical rather than FOMO. That’s because ETFs were notably absent.

But, the rare clover popped up signalling a change just this morning.

In this chart, red sticks indicate the daily number of ETF sell signals, while green sticks are buys.

Look how big buying in ETFs is just starting to show up. Yesterday put us at a level we haven’t seen since mid-January.

This is bound to happen after a huge rally takes hold as buyers feel safe to redeploy capital into larger instruments.

I’ve circled 2 prior periods of large green sticks and the right-most circle is the ETF buying sproutling:

ETF buying is picking up

But ETFs aren’t the only green shoots.

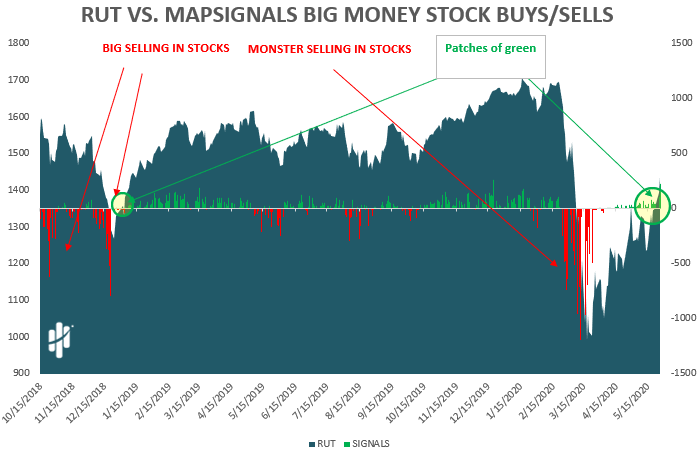
Buying In Stocks Is Picking Up

Big buying in stocks is accelerating. Yesterday was the single largest day of buying in 2020.

This makes since as markets are ripping higher on real volumes. We’ve been in a vacuum for months after the crash in March. Markets and stocks take time to reset; now we are resetting.

Overbought periods can last for many weeks, similar to now. Our data says when we go overbought after deeply oversold markets, the average overbought period is 20 trading days. It’s only been 15 thus far. The longest period was 68 trading days – or more than 3 months. As we said last week, we’re in the investing bonus level. Long portfolios can rack up a lot of gains during these periods.

Below is a chart of daily stock buys and sells. We net them out, so a green stick means net buyers and a red stick means net sellers. I’ve circled this week’s patches of green.

Yesterday was the single largest day of net buys in 2020:

buying in stocks is picking up

Let’s zoom in:

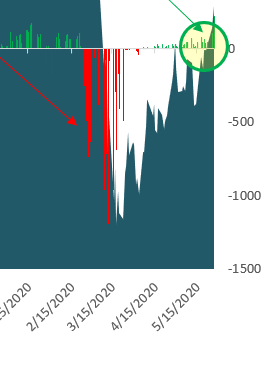
This shift was bound to happen. Markets were severely depressed and then snapped back. Now momentum, and likely some FOMO, is starting to take over.

New Information Is Like Finding A 6 Leaf Clover

Many are puzzled by the current market action.

The news headlines are terrible: We are in a pandemic. People are dying.  The economy is not doing much better. Yet stocks are staging a massive rally in the face of grim news.

Markets went overbought and for now, are staying there.

You may want to ask:

“When will it end?”

“Shouldn’t I try to get ahead of it?”

We just follow our data.

Remember: the Big Money Index is like mama goose. Where she goes, her babies (market) tend to follow.

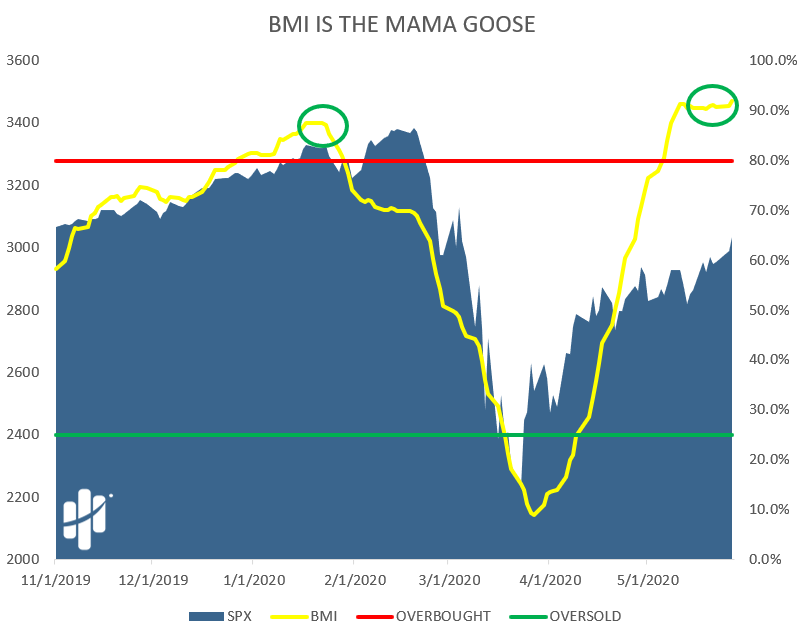
As you can see, the BMI has been flat-lining for a while now.

Following the big money makes it easier for us to cut through the noise.

It’s kind of like trying to find the outliers in the clover fields.

Eventually you learn how. When you’re patient and know where to focus, the 4 leaf clovers start to jump out at you.

Once in a blue moon- you can find a 6 leaf clover…

Lucas Downey
Lucas Downey

Lucas is co-founder of MAPsignals. His full bio can be found here.
Prior to MAP, he was Head of ETF Sales at Cantor Fitzgerald & SVP of Derivatives at Jefferies, LLC.

Spread the word!

Category: All, Big Money Insights Weekly, Special Reports

Previous Post: « Investing Bonus Level
Next Post: Record Breakers »

Reader Interactions

Comments

  1. Andre

    May 28, 2020 at 12:26 pm

    Hiya Guys,

    I’ve held my money as cash in my investment account awaiting the overbought market downturn and Q2 results before jumping back in.

    Do you think it may be a good idea to jump back in now and accumulate somewhat during the “bonus level”?

    Thanks,
    Andre

    Reply
    • Mapsignals Staff

      May 28, 2020 at 1:00 pm

      Hey Andre –

      We can never give personal advice of any kind. You’d want to speak with a financial advisor about any personal investments.

      That being said, this market is taking many by surprise. Over the years, we’ve tried to not be surprised by anything that the market does…it’s not always easy!

      All we can do is try and understand where the big money is likely going.

      Thanks for reaching out.

      -The Mapsignals Team

      Reply
      • ANDRE

        May 28, 2020 at 4:05 pm

        Understand your position, thank you for the advice.

        Reply
  2. Richard M.

    May 28, 2020 at 1:28 pm

    What is the term FOMO?

    We told you the overbought market was more technical rather than FOMO.

    Reply
    • Mapsignals Staff

      May 28, 2020 at 1:31 pm

      Hey Richard –

      FOMO stands for fear of missing out. It’s become a popular term with stocks over the past couple of years.

      Thanks for reaching out!

      -The Mapsignals Team

      Reply
  3. merlyn

    May 28, 2020 at 10:20 pm

    Thank you for the article. Been reading the recent article you guys posted for the last few weeks now and kind of trying to picture it into the real market…. considering the big ETF is coming in to play, wouldn’t that keep increasing the BMI and keep the market in oversold position and keep it shooting up? Just to understand if purely using BMI to gauge the market, how accurate can it be? I’m on the learning curve here…
    I noted in the article says we are only 15 days into the overbought territory based on BMI data, and the average is 20 days. To clarify, does this means after the BMI peaked for a while, and it drops the market will also follow? What is the data based on?

    Eventually what goes up must come down (doesn’t have to be alot, but a slight dent will do to adjust the overall)

    Reply
    • Mapsignals Staff

      May 29, 2020 at 5:55 am

      Hey Merlyn,

      Yes – if big buying continues it will likely keep the BMI in overbought territory. The thing is, when we get an overbought signal it doesn’t mean anything other than “pay attention.”

      Not all overbought periods are the same. Markets bob and weave based on different catalysts. Right now, we are in unprecedented times in terms of market action. But, we try and observe it from a data standpoint.

      Typically, not always, when the BMI starts to fall from overbought it’s because buying slows or selling picks up…or both. We don’t know everything, but odds are that the market will pullback eventually. Likely, we’ll see some data points signaling that change.

      -The Mapsignals Team

      Reply
  4. Faiq

    June 6, 2020 at 5:56 am

    Hi – I am still a bit confused after reading the article, reader comments and your responses.

    I appreciate no one has a crystal ball, but based on the BMI trading indicator (and based on historical market trends versus BMI), will the markets go up or down in the next 1 week, 1 month and 3 months?

    Thanks,
    Faiq

    Reply
    • Mapsignals Staff

      June 6, 2020 at 6:13 am

      Hey Faiq –

      We are data scientists. Keep in mind that right now, and pretty much all of 2020, has been extreme in terms of data. Markets crashed in March and now they are racing higher at an unrivaled pace. We are excited to be capturing data in such epic periods.

      The BMI follows the big money. Big Money can stay elevated for long periods of time. The key, for us, is when the BMI begins to change course. That may let us know when the buying in stocks is slowing. Historically, when buying slows, the BMI falls. When the BMI falls, stocks and markets tend to follow shortly after.

      So, the question to us isn’t “have we reached the top”? To us, the better question to ask is “has the big money changed direction?”

      The BMI is like surfing a wave. Sometimes the wave is 6 feet tall, while other times it is 40 feet tall. Good surfers will adjust how they handle either. But, as we and surfers know, waves eventually crest. That is what we try and alert for.

      Hope this helps –

      -The Mapsignals Team

      Reply
  5. Don

    June 28, 2020 at 5:40 pm

    Good evening guys. Just subscribed today and really curious how the BMI will help me in making choices in equities and option spreads. I have always been curious about what the industrial and big money investors are doing with their money, now I have that data. Can only say “thanks” for giving us that opportunity. In looking through your information on performance though, i could only find data representing the last half of 2019. Can you furnish me any performance stats for 2020?

    Reply
    • Mapsignals Staff

      June 29, 2020 at 8:31 am

      Hey Don –

      As of mid-Juneish, our calculations show that the stocks picked in 2020 are up 10% on average. This is compared to +5.33% had you just invested in the S&P 500 (SPY).

      For options, those that were picked in 2020 as of today and had you held the longs created from the short puts: 12 trades with 11 winners. The average gain is +~$7800.

      Obviously, these returns are hypothetical and assume someone can get into the trade at the price on the report. It also assumes being put into a stock and holding it as of this morning. Those that follow us know that if we suggest selling a put, it’s a stock we wouldn’t mind owning.

      -The Mapsignals Team

      Reply

Leave a Reply Cancel reply

Your email address will not be published. Required fields are marked *

Primary Sidebar

Get Big Money Insights for FREE

Want to know where the Big Money is headed?

Just enter your email address below. You'll get our FREE NEWSLETTER sent directly to your inbox.

We call it Big Money Insights... It’s your weekly sneak peek at the powerful market-moving forces that are hidden from 99% of investors.

"*" indicates required fields

This field is for validation purposes and should be left unchanged.

Categories

  • All
  • Big Money Insights Weekly
  • Big Money Series
  • Macro Insights
  • MAP In The Media
  • Members Only
  • Performance
  • Podcast
  • Special Reports
  • Stocks
  • Videos & Interviews
  • White Papers

Archives

  • February 2023
  • January 2023
  • December 2022
  • November 2022
  • October 2022
  • September 2022
  • August 2022
  • July 2022
  • June 2022
  • May 2022
  • April 2022
  • March 2022
  • February 2022
  • January 2022
  • December 2021
  • November 2021
  • October 2021
  • September 2021
  • August 2021
  • July 2021
  • June 2021
  • May 2021
  • April 2021
  • March 2021
  • February 2021
  • January 2021
  • December 2020
  • November 2020
  • October 2020
  • September 2020
  • August 2020
  • July 2020
  • June 2020
  • May 2020
  • April 2020
  • March 2020
  • February 2020
  • January 2020
  • December 2019
  • November 2019
  • October 2019
  • September 2019
  • August 2019
  • July 2019
  • June 2019
  • May 2019
  • April 2019
  • March 2019
  • February 2019
  • January 2019
  • December 2018
  • November 2018
  • October 2018
  • September 2018
  • August 2018

Follow us on Twitter

MAPsignals Follow 1,434 1,061

MAPsignals is a data platform that tracks institutional money flows in stocks and ETFs. Sign up for free insights here: https://t.co/SaAVHjKC9J

mapsignals
mapsignals avatar; MAPsignals @mapsignals ·
49m 1621476848990359552

Pendulum has swung

Helene Meisler @hmeisler

Highest volume for the QQQs since 12/13

Reply on Twitter 1621476848990359552 Retweet on Twitter 1621476848990359552 0 Like on Twitter 1621476848990359552 0 Twitter 1621476848990359552
Load More...

Footer

© 2021 Mapsignals.com

  • Home
  • Contact & Disclaimer
  • Privacy Policy
  • Terms & Conditions
  • Opt-out preferences
  • FAQ

Copyright © 2023 · Mai Law Pro on Genesis Framework · WordPress · Log in

✕
What Happened to Risk Assets White Paper is Here

Get your copy here and take a journey through our thoughts on margin and leverage.

Enter your email address below and you'll get our FREE NEWSLETTER sent directly to your inbox. 

 We call it Big Money Insights... It’s your weekly sneak peek at the powerful market-moving forces that are hidden from 99% of investors.

MAPsignals
Manage Cookie Consent
We use cookies to optimize our website and our service.
Functional Always active
The technical storage or access is strictly necessary for the legitimate purpose of enabling the use of a specific service explicitly requested by the subscriber or user, or for the sole purpose of carrying out the transmission of a communication over an electronic communications network.
Preferences
The technical storage or access is necessary for the legitimate purpose of storing preferences that are not requested by the subscriber or user.
Statistics
The technical storage or access that is used exclusively for statistical purposes. The technical storage or access that is used exclusively for anonymous statistical purposes. Without a subpoena, voluntary compliance on the part of your Internet Service Provider, or additional records from a third party, information stored or retrieved for this purpose alone cannot usually be used to identify you.
Marketing
The technical storage or access is required to create user profiles to send advertising, or to track the user on a website or across several websites for similar marketing purposes.
Manage options Manage services Manage vendors Read more about these purposes
View preferences
{title} {title} {title}