• Menu
  • Skip to right header navigation
  • Skip to main content
  • Skip to primary sidebar
  • Skip to footer

MAPsignals

We map big money.

  • Latest Insights
  • Power of MAP
    • MAP Products
    • MAP System
    • MAP White Papers
    • Videos & Interviews
  • Profit with MAP
  • About
    • About MAP
    • MAP Team
    • Authors
    • MAP System
    • MAP Products
    • Big Money Index
  • Members
    • Get Started With MAP
    • My MAP
    • Big Money Charts
    • MAP View
    • MAP View Options
    • MAP Top 20 Weekly
    • MAP 50
    • Member Updates
    • Platinum Updates
    • Members Only Posts
    • Performance
  • Portal

Big Money Index Approaches Overbought

December 15, 2022 //  by Lucas Downey//  4 Comments

Watch and learn.

Those 3 words were uttered to me by a veteran trader years ago. His message was simple: Pay attention to how the market trades. That’s the signal.

That memory rings loud and clear today as the Big Money Index approaches overbought.

Big Money Index Approaches Overbought

Back in my Wall Street days, intuition was the name of the game. Traders had an old school way of doing business, transacting on phones and booking trades on paper tickets. They would size up markets by reading the tape.

That means they paid attention to volumes and how markets and stocks traded. The underlying trend was more inciteful than news headlines. I learned early on to respect the flow of money – supply and demand was the key to becoming a successful trader.

Fast forward to today, and MAPsignals was born out of many of those unforgettable experiences. Our data reveals trends, patterns and more. The flow of money has been one-way for months – UP.

Today I’ll walk you through why the Big Money Index is pushing higher and what you’ll want to pay attention to in the coming weeks.

Big Money Index Approaches Overbought

Respect the trend. For months, the Big Money Index has been heading north. Late October we were oversold and witnessing the weakest breadth reading since the pandemic.

Those are the moments to strap in, because once the rally starts, it can wow the crowd. And it did. Look how the BMI has pointed straight up since. Today we sit at 73%, inching closer to an overheated reading of 75% and overbought (red line) triggers at 80%:

Since Oversold in October the BMI has been up | Big Money Index

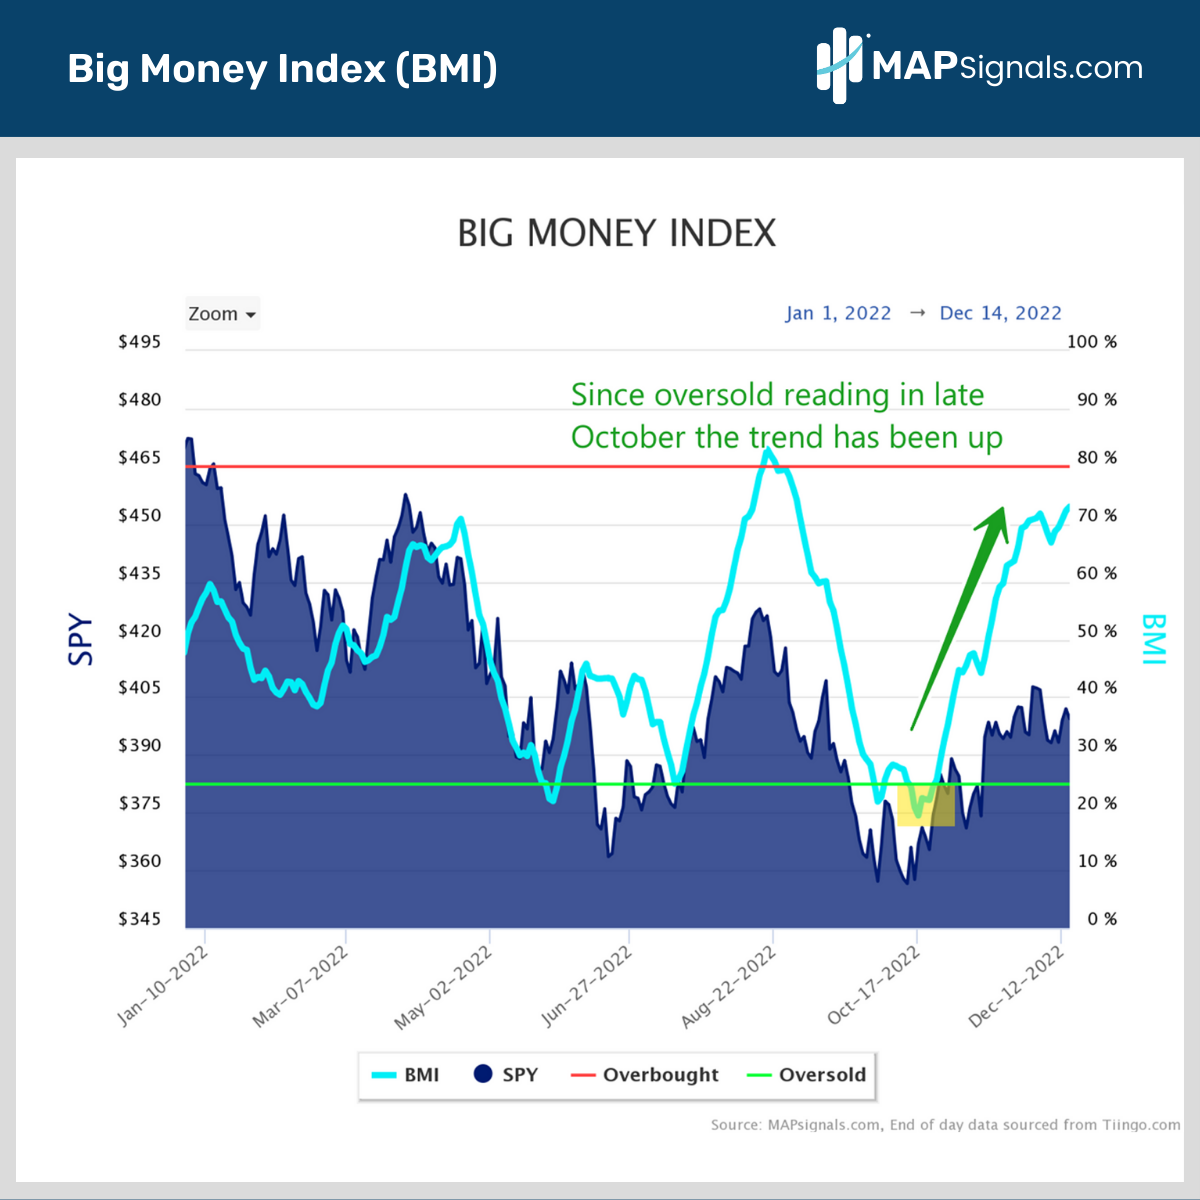
Keep in mind this rip was expected as mid-term election years tend to see an overbought BMI in December and January. That enforced the narrative that we were setting the stage for a yearend rally. I still believe that’s the case.

Diving further we see how heavily skewed buying the last month has been. Blue bars reveal that buyers have been in control of the tape:

Money flows skewed heavily to buyside | Big Money Stock Buys & Sells

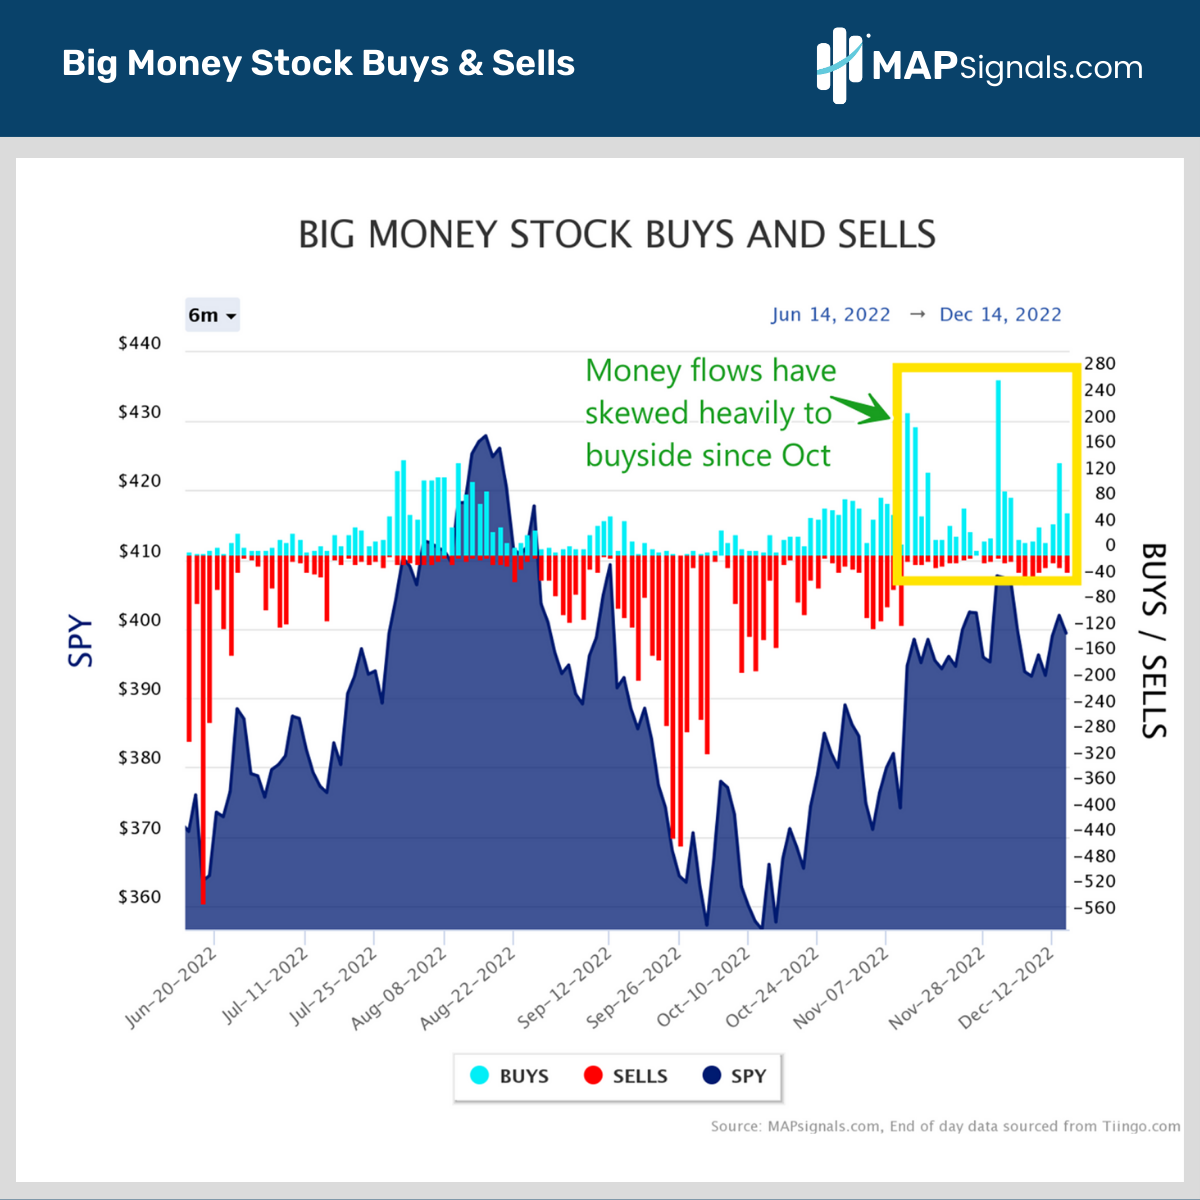
Under the surface, there’s been a strong bid for stocks. Certain groups have been thriving. They’re the reason the Big Money Index approaches overbought.

Let’s breakdown the 5 areas attracting inflows.

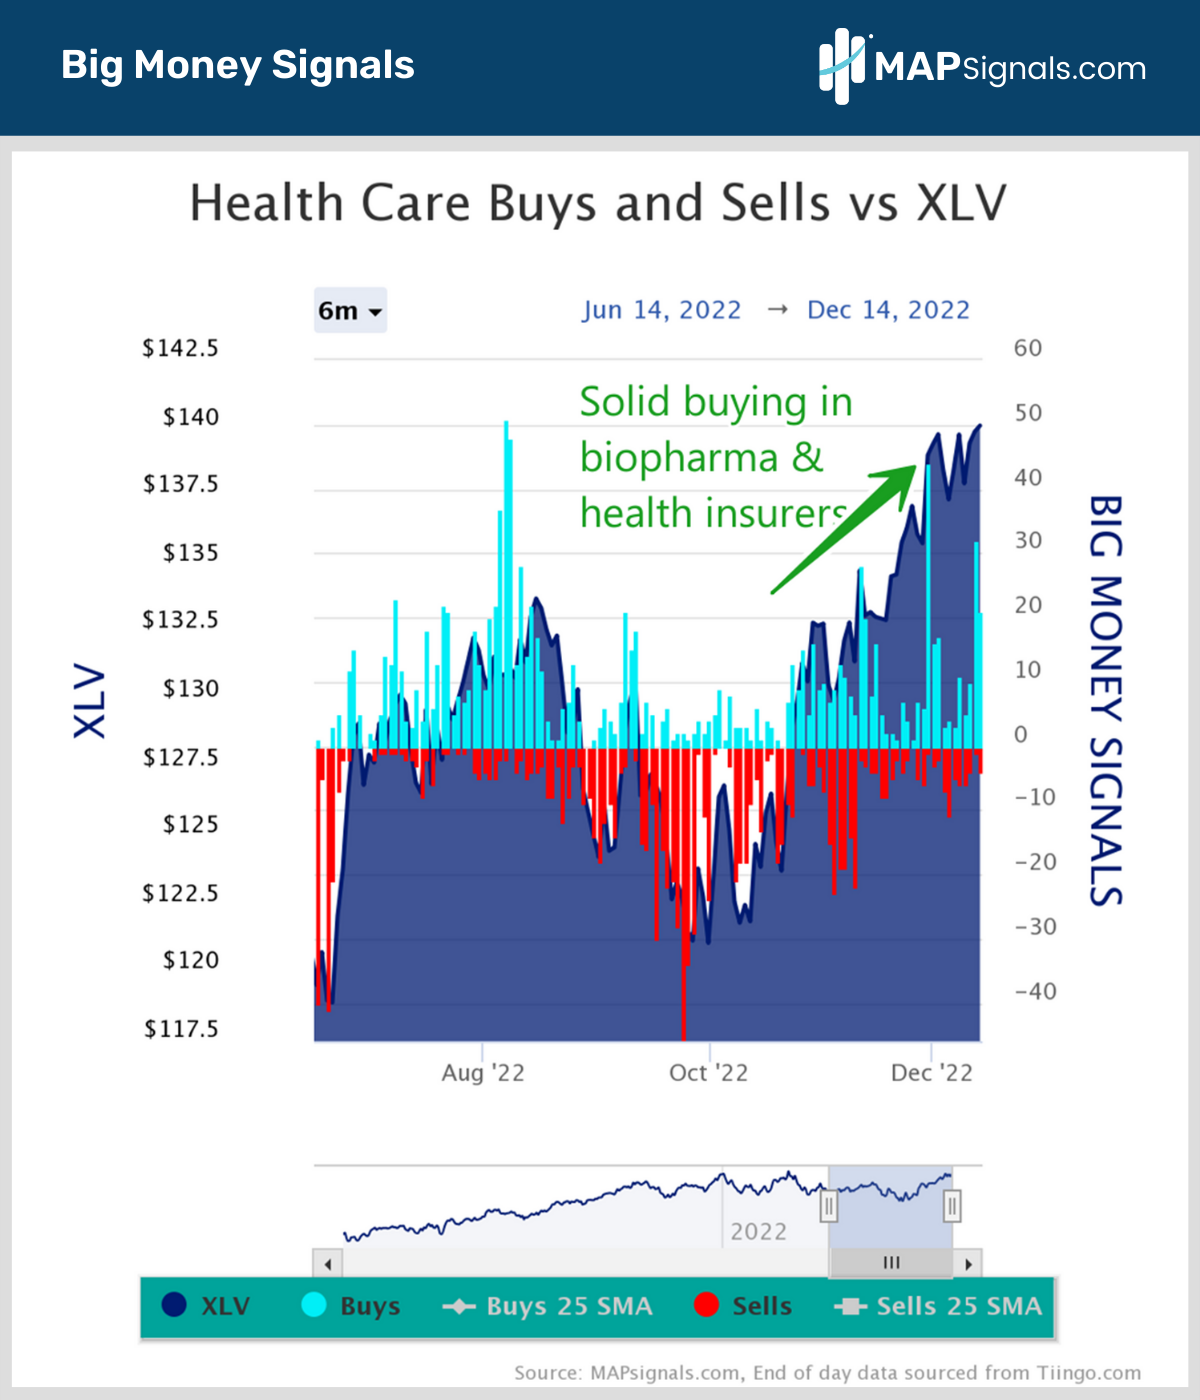
First, there’s healthcare. This defensive group has been one of our top sectors attracting investors. Recession fears often send investment dollars into “safer”, dividend paying areas. Biopharma and health insurers have been beaming lately:

Solid buying in biopharma & health insurers XLV | Big Money Signals

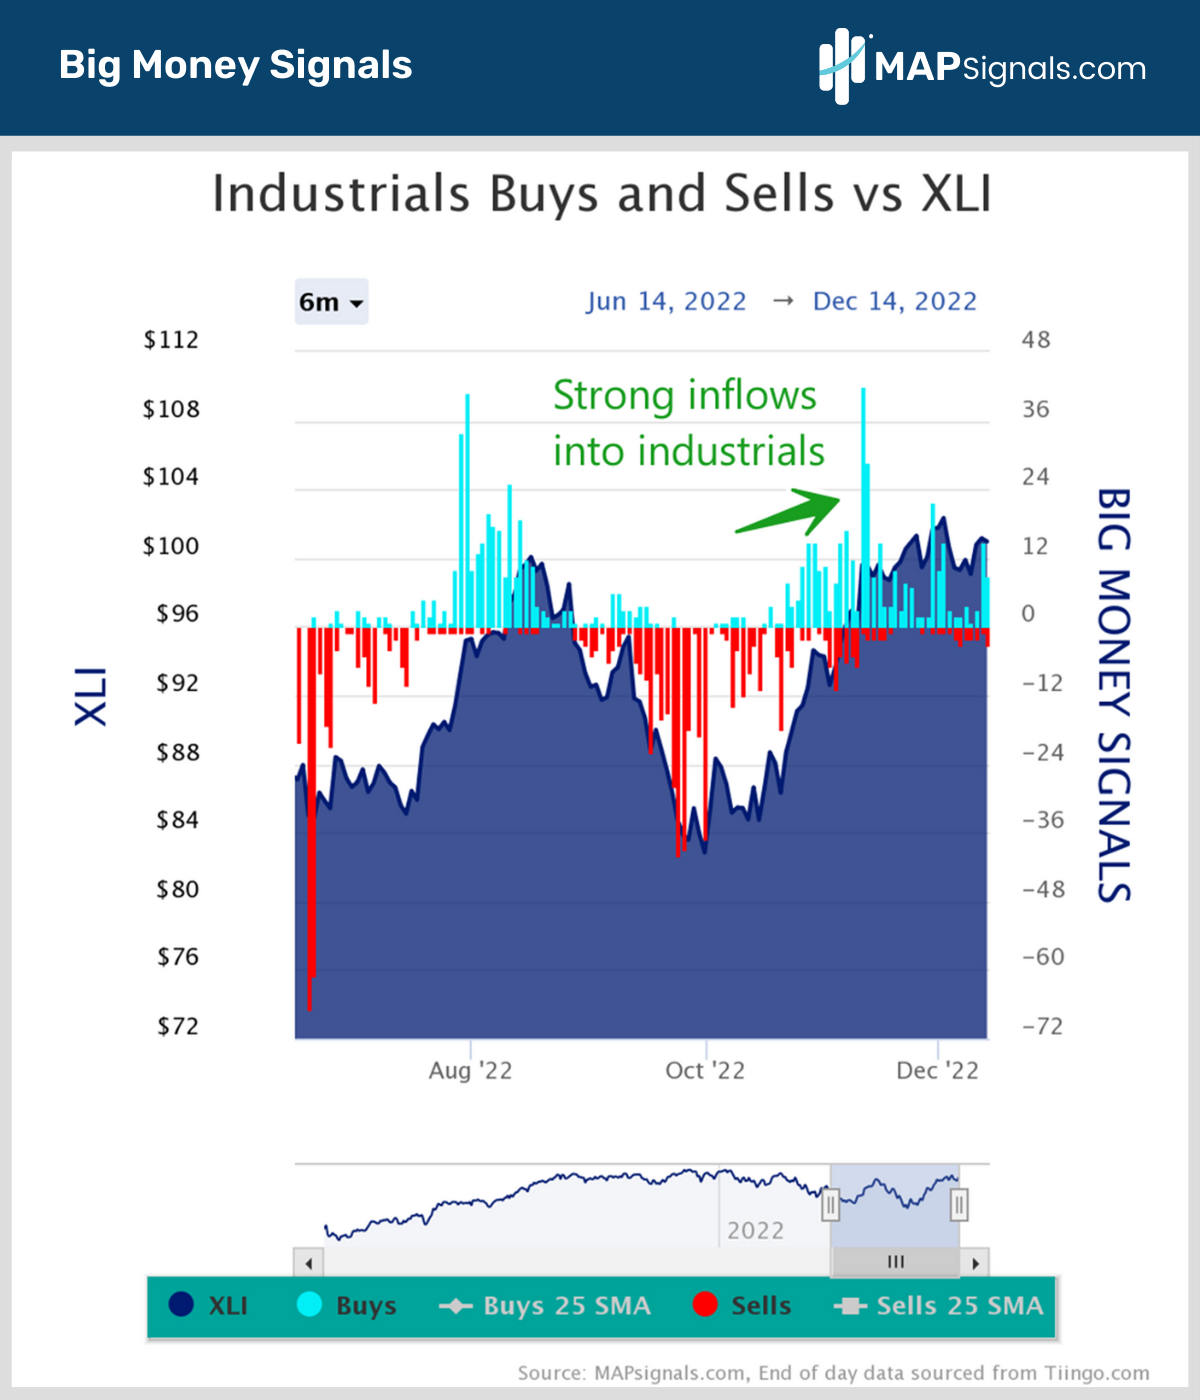
Next there’s industrials. Defense, machines, road & rail stocks – those have been beacons for capital lately:

Strong inflows into Industrials XLI | Big Money Signals

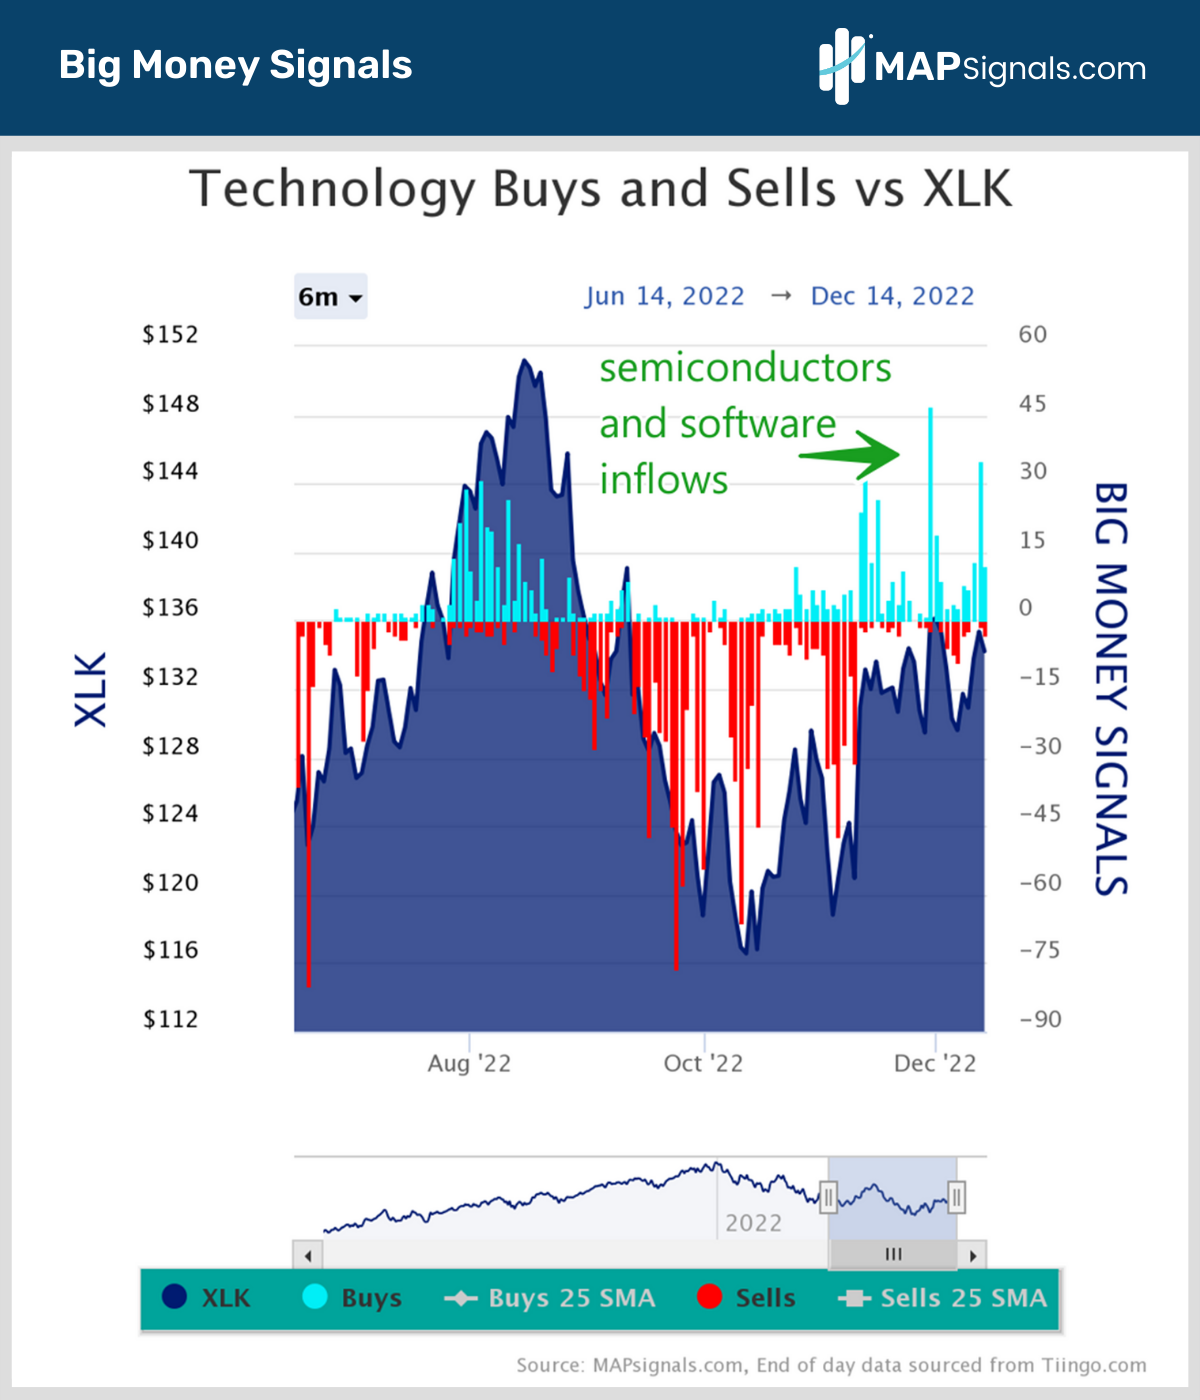
Even technology stocks have joined the rally. Below you’ll notice chunky blue signals. Semiconductors and software stocks have been under accumulation:

Semiconductors & Software inflows in Technology | Big Money Signals XLK

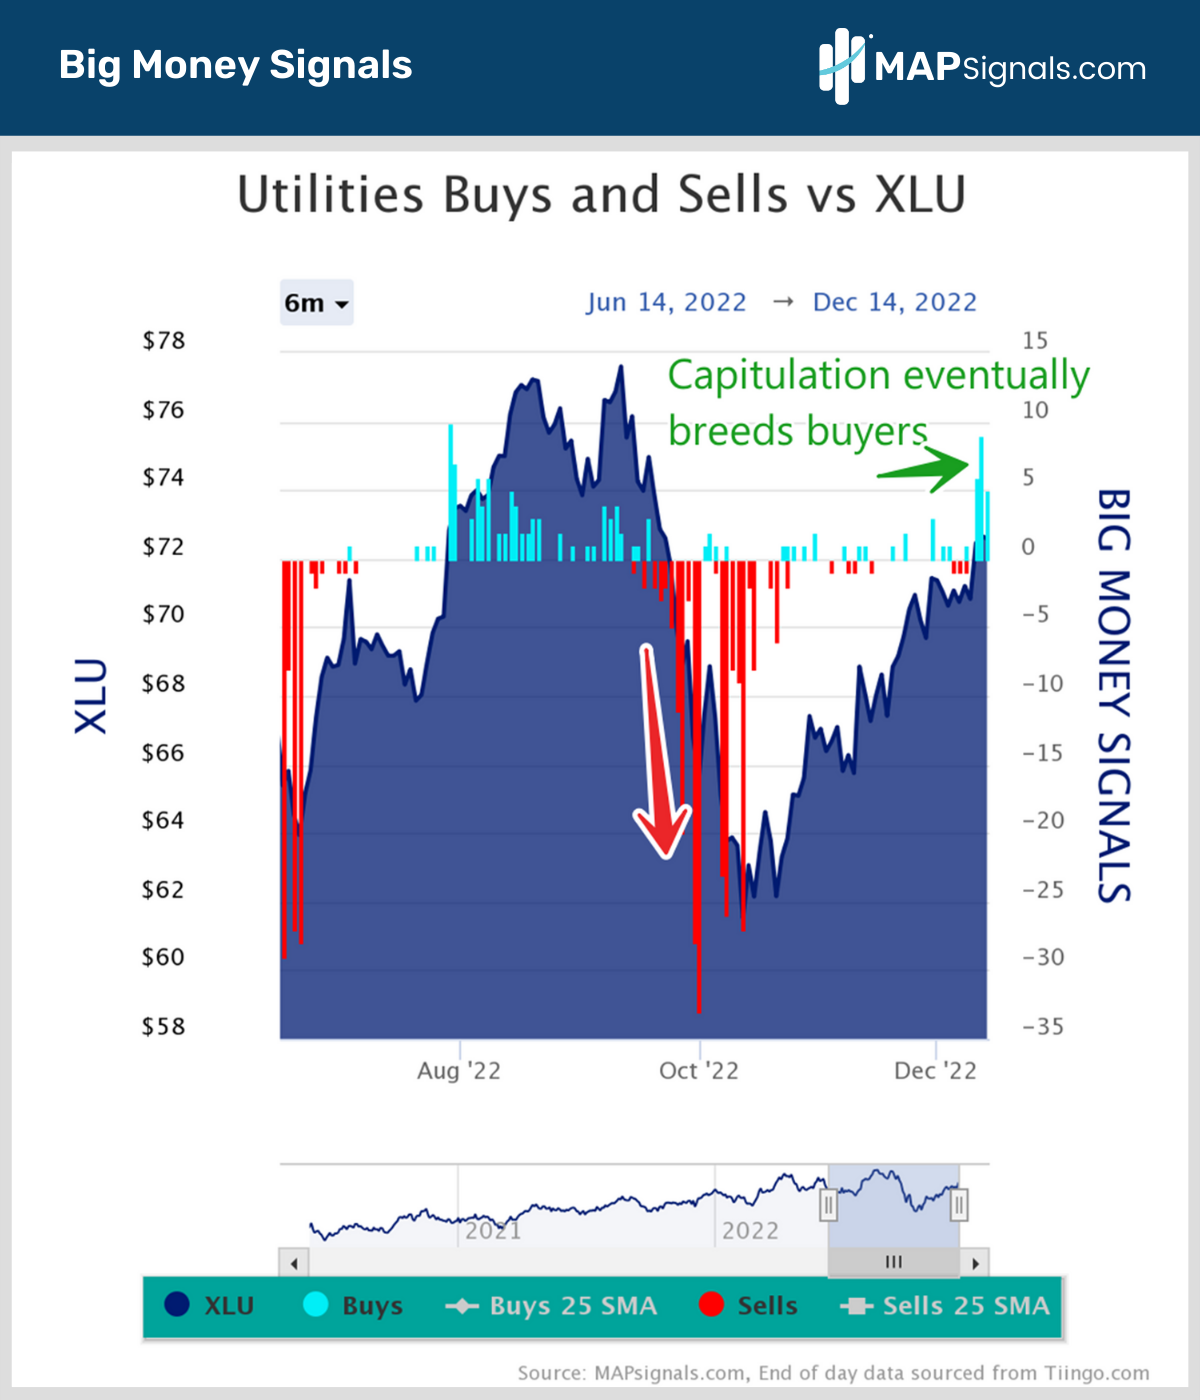
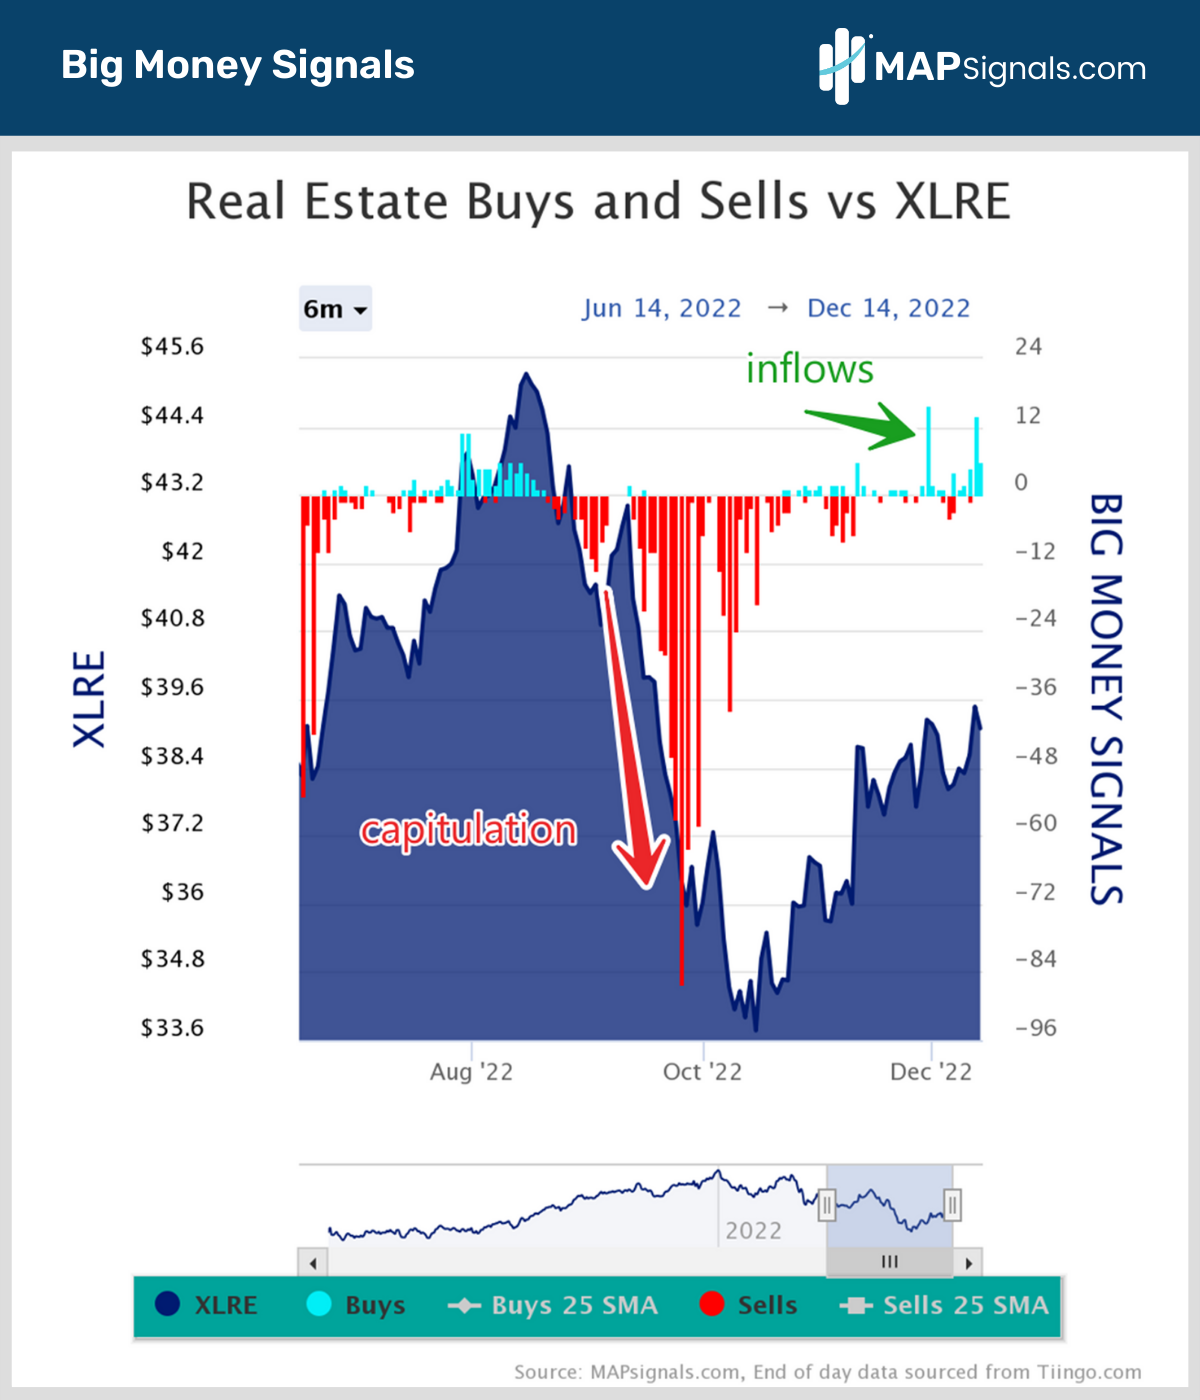
Lastly, yield-sensitive groups like Utilities and Real Estate have been perking up in our data, too. As rates fall, these dividend-rich groups become more attractive to investors.

Both have signaled inflows recently. Utilities companies were sold hard in October. Capitulation often offers attractive entry points:

Capitulation eventually breeds buyers - Utilities XLU | Big Money Signals

Real Estate shows similar patterns to utilities. Big selling often ends, leading to buyers:

Inflows in Real Estate XLRE | Big Money Signals

These 5 areas of the market are signaling healthy buying. That’s been the trend for months. And it’s the main reason the Big Money Index approaches an overbought.

If you’re a trader, once we reach the red zone (overbought), consider trimming risk after falling from overbought (near 75%) or rotating into a more defensive posture.

The last time we visited the red area was mid-August. Back then I discussed your sell signal to take profits… markets swiftly pulled back within days.

Keep in mind, we aren’t at risk of hitting overbought today or tomorrow… but at 73% the yellow light is flashing.

Chances are that buying will be unsustainable once that threshold is breached. But don’t be fearful – use it for what it is: an opportunity to go shopping for great stocks.

Let’s wrap up.

Here’s the bottom line: Our data is signaling solid buying under the surface of the market. The Big Money Index approaches overbought.

5 areas are leading the inflows: healthcare, industrials, tech, real estate and utilities. These are the outperforming groups… the alpha generators. Some of the best performing stocks in our research reside here.

MAPsignals is your map of the market. Focus less on news headlines and follow the trend of money.

Data allows you to watch and learn and become a better investor.

Get started with a subscription today!

Lucas Downey
Lucas Downey

Lucas is co-founder of MAPsignals. His full bio can be found here.
Prior to MAP, he was Head of ETF Sales at Cantor Fitzgerald & SVP of Derivatives at Jefferies, LLC.

Spread the word!

Category: All, Big Money Insights Weekly

Previous Post: « Market Volatility Update 12-14-2022
Next Post: 3 Best ETFs to Buy in a Recession 2023 3 Best ETFs to Buy in a Recession 2023»

Reader Interactions

Comments

  1. Jacob

    December 15, 2022 at 1:31 pm

    The question for the next 2 weeks is will the big money reverse after the hawkish comments from the Fed this week. Will there be the usual Santa Clause rally yes or no?

    Reply
    • MAPsignals Staff

      December 15, 2022 at 1:36 pm

      Certainly there’s a historical Santa rally to consider based on history. Our hunch is after the hawkish fed, it’s going to keep market’s range bound near-term. That being said there will be plenty of leading stocks under the surface.

      Thanks for the comment

      Reply
  2. McReddy

    December 15, 2022 at 2:53 pm

    Lucas, in my limited knowledge , big money supposed to be accounting for 75% of market and when all Indexes ( spy) are in red how is it possible to that big money index is at 73%? Does this mean retail investors account for major portion of the market? Please explain so all your customers could learn from your explanation . Thanks , mcreddy.

    Reply
    • MAPsignals Staff

      December 15, 2022 at 3:05 pm

      73% indicates the ratio of stocks getting bought versus sold over 5 weeks. Given many more companies are rising with increasing volumes, the BMI is in an uptrend. Fear has been low, which can change at elevated levels.

      Most of the money flows have been institutional in our opinion the last month+. The recent buying in ETFs does signal recent retail participation.

      Thanks for the comment

      Reply

Leave a Reply Cancel reply

Your email address will not be published. Required fields are marked *

Primary Sidebar

Get Big Money Insights for FREE

Want to know where the Big Money is headed?

Just enter your email address below. You'll get our FREE NEWSLETTER sent directly to your inbox.

We call it Big Money Insights... It’s your weekly sneak peek at the powerful market-moving forces that are hidden from 99% of investors.

"*" indicates required fields

This field is for validation purposes and should be left unchanged.

Categories

  • All
  • Big Money Insights Weekly
  • Big Money Series
  • Macro Insights
  • MAP In The Media
  • Members Only
  • Performance
  • Podcast
  • Special Reports
  • Stocks
  • Videos & Interviews
  • White Papers

Archives

  • February 2023
  • January 2023
  • December 2022
  • November 2022
  • October 2022
  • September 2022
  • August 2022
  • July 2022
  • June 2022
  • May 2022
  • April 2022
  • March 2022
  • February 2022
  • January 2022
  • December 2021
  • November 2021
  • October 2021
  • September 2021
  • August 2021
  • July 2021
  • June 2021
  • May 2021
  • April 2021
  • March 2021
  • February 2021
  • January 2021
  • December 2020
  • November 2020
  • October 2020
  • September 2020
  • August 2020
  • July 2020
  • June 2020
  • May 2020
  • April 2020
  • March 2020
  • February 2020
  • January 2020
  • December 2019
  • November 2019
  • October 2019
  • September 2019
  • August 2019
  • July 2019
  • June 2019
  • May 2019
  • April 2019
  • March 2019
  • February 2019
  • January 2019
  • December 2018
  • November 2018
  • October 2018
  • September 2018
  • August 2018

Follow us on Twitter

MAPsignals Follow 1,449 1,070

MAPsignals is a data platform that tracks institutional money flows in stocks and ETFs. Sign up for free insights here: https://t.co/SaAVHjKC9J

mapsignals
mapsignals avatar; MAPsignals @mapsignals ·
18h 1622987016957820928

One of my favorite #dividend #stocks having a day - Skyworks Solutions $SWKS - owned it for years

The $2B buyback is pretty significant given the market cap is sub $19B

#Semiconductors continue to see major inflows

Reply on Twitter 1622987016957820928 Retweet on Twitter 1622987016957820928 0 Like on Twitter 1622987016957820928 2 Twitter 1622987016957820928
Load More...

Footer

© 2021 Mapsignals.com

  • Home
  • Contact & Disclaimer
  • Privacy Policy
  • Terms & Conditions
  • Opt-out preferences
  • FAQ

Copyright © 2023 · Mai Law Pro on Genesis Framework · WordPress · Log in

✕
What Happened to Risk Assets White Paper is Here

Get your copy here and take a journey through our thoughts on margin and leverage.

Enter your email address below and you'll get our FREE NEWSLETTER sent directly to your inbox. 

 We call it Big Money Insights... It’s your weekly sneak peek at the powerful market-moving forces that are hidden from 99% of investors.