
Construction Zone
We’ve all seen “SLOW – CONSTRUCTION ZONE” signs while we’re cruising along the highway.
They tell us to slow down and watch out for workers.
It’s the right thing to do to be safe for both the drivers and the road crew. But there’s also a stiff penalty if you don’t. There are plenty of reminders of maybe a $200 fine for speeding in a work zone.
Of course, we need plenty of warning, because slowing down from 70 mph to 15 isn’t safe to do instantly either. Signs appear well in advance of the actual road work. That cool down period gives you time to adjust, adapt, and react to the new surroundings.
Financial markets aren’t just numbers on a screen. At heart, they are expressions of the individuals behind the buttons placing buy and sell orders. Even if machines do much of the trading these days, machines were programmed by people.
So, it’s logical that markets face congestion zones too. It’s part of the game.
Unfortunately, no one is holding up a sign in your brokerage account saying “SLOW DOWN! CONGESTION UP AHEAD.” Lacking warnings like this can inflict nasty fines on your portfolio.
Yet, at Mapsignals, we get alerts well in advance of “construction zone” signs. We see the market brake lights up ahead…so, we adjust. We are devoted to sniffing out big money, and when they act. It’s usually well in advance of moves up ahead. It stands to reason: big money needs to invest with an edge over the little guys. But they don’t keep that edge by telegraphing it to the world.
You need a systematic way to identify their silent movements anticipating market bends in the road. That’s where we come in.
Mapsignals’ data has been warning investors who listen: “Slow down, congestion ahead. Penalties are increased for speeding in a construction zone.” Let’s look at what they really say…

Big Money Index Hits Market Construction Zone
It should come as no surprise that the Big Money Index is falling. For nearly a month, we’ve highlighted mega-extremes in our data. On June 4th, Record Breakers spoke of massive buying across the board in stocks and ETFs.
We said “buying like that rarely lasts”- and we were right.
Since that post the S&P 500 (SPY ETF) returned -.09% including a deeper pullback and subsequent recovery. Compare that to the prior ~2 months’ return:
- 5/4 – 6/4 SPY returned +9.8%
- 4/4 – 5/4 SPY returned +7.06%
June 4th is essentially when we started seeing the construction cones ahead. But since that Record Breakers post, our data has changed significantly.
Look how the Big Money Index has been falling recently:
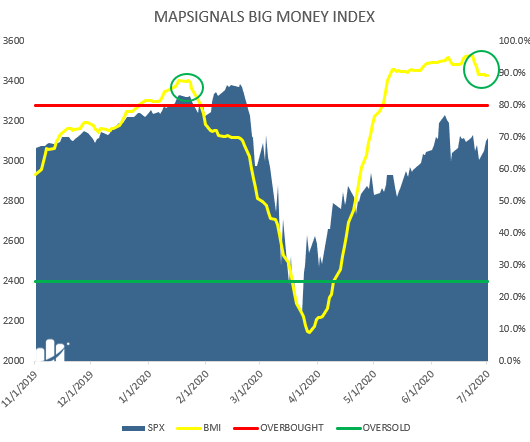
As a reminder, the BMI falls for 2 reasons:
- Buying in stocks slows down
- Selling in stocks picks up
This is important because it sets the stage for what comes next – the market construction zone.
We look at our data each day. And for the past 4 weeks it has caused us to slow down and rubberneck.
Big Money traffic has clearly been slowing down.
Sector Buying In Stocks Hits A Speed Bump
Three weeks ago we published, Initial Descent. At the time, our data waved a caution flag. It was nearly impossible for us to be bullish interpreting our data.
Let’s replay what the market did right after that post. The S&P 500 (SPY ETF) had 3 ugly selloffs:
- June 11th, SPY fell -5.76%
- June 23rd, SPY fell -2.55%
- June 25th, SPY -2.38%
That is what a market construction zone looks like: 5 lanes of traffic merged into one.
Another place to look is at the velocity of stock buying. We showed you extremes on June 11th for some sectors. Pay attention to how buying suddenly bottle-necked.
Below we monitor buying velocity in 3 sectors: Technology, Materials, & Discretionary.
When the green line increases, the 25-day moving average of buys is increasing. The past few weeks show deceleration:

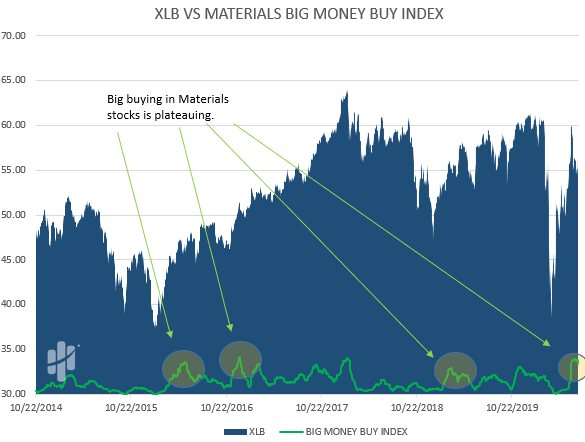
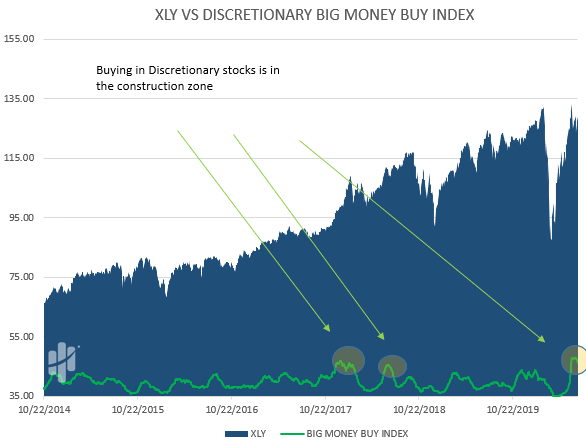
Look- this clearly shows big buying is slowing down. But keep in mind that indexes can and often do continue to power higher.
This is especially true for indices that are market-cap weighted, like the S&P 500 and NASDAQ 100. This means that a handful of stocks are responsible for nearly all of the gains.
Due to all of this data, we at Mapsignals slowed down. We warned of buying at these levels, and suggested taking profits and readying cash for an imminent pullback. It may take a while, but until our data signals a change, we believe we’re still in the market construction zone.
But, remember: we also believe that outlier stocks go up over time regardless of market fluctuations.
So what about outliers?
Funny you should ask!
Outlier Stocks – TAGU
We have a little mantra at Mapsignals. It describes the best stocks out there. We realized a decade and a half ago, while sitting on trading desks, that regardless of what markets do, great stocks have one thing in common. They all go up. (Historically speaking at least.)
The backdrop could be a terrorist attack. It could be a housing crisis, political scandal, trade uncertainty, insolvent countries, or whatever other doom scenarios the headlines cook up. I mean, bring on a pandemic that stops the world in its tracks, and you’ll still have stocks that knock it out of the park.
The mantra is “TAGU” which is an acronym for:“They all go up.” (let us know if you’re interested in a TAGU tee-shirt. With enough interest we’ll get some made.)
They means outliers. Regardless of crashes, doom-and-gloom headlines, fear, or euphoria – the bottom line is this: the best stocks make you rich over the long-term because TAGU.
We started our firm 6 years ago to find those stocks. It was born out of nearly 15 years of research prior. While not all stocks go up, obviously there are a small number of them that keep rising over the years.
It’s a nice story to make you feel good, but hey- we’re all about data here at Mapsignals. Nothing speaks louder than black and white numbers…
So, how did Mapsignals perform with our stock picks for the first 6 months of 2020?
We’ll let you be the judge…
As of the 6/30 closing prices, here are the returns for all weekly picks from the MAP View:
*hypothetical performance that may or may not be possible to achieve
If you’re dying to know the actual stocks we picked, those are for our members only. Members get those stocks each week at all levels of subscription. You can learn more about that cool report and membership here.
We’re not your usual stock research people. We love this stuff and find it immensely fun- not stuffy. So performance like that is what we call juice… when our stock picks more than double the market- that’s juice!
It’s so juicy in fact, we are thinking of renaming our boring BLOG to JUICE BAR. Why? Because that’s where you get the juice! (We’re half serious…feedback welcomed…)
OK, taking a breath…, let’s take it a step further.
Those were all the stock picks for the first six months. But what about our best stocks?
Now, check out how that basket of stocks did the first half of 2020:
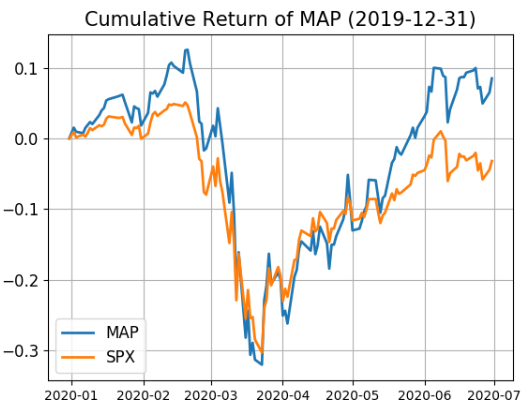
*hypothetical performance that may or may not be possible to achieve
Our 6-month strategy basket clocked +8.52% vs -3.18% for SPX. Guys and gals- that’s outperforming the market by 3.7 times…
Mic drop.
Here’s the bottom line: those desperate to time the market should pay attention to big money signals. Slowdown when there’s construction up ahead.
But if you’re in the best stocks, you really don’t need to worry long term. Why? Because TAGU- that’s why.
“They all go up.” Outliers tend to keep making new highs year after year. It’s what they do.
We think we’ll be right years from now when we say TAGU.
In fact, we’re betting on it.
Maybe you will too… in your faded TAGU tee shirt. And when someone asks you what it means, you can just wink and smile, and say…
“They All Go Up.”