Initial Descent
“This is your captain speaking. Take the time now and get up and move around the cabin. We will begin our initial descent shortly.”
I’m sure most of us have heard that while flying. It’s the signal that, soon, the path will change course.
If our data could speak, the message would be similar to the captain. Thankfully it does.
Last week saw extreme buying across the board. Fear of missing out is here. Looking forward, our data says to expect a decrease in altitude.

Big Buying In ETFs Signal Initial Descent
A great gauge for what mom ‘n pop are doing is ETF activity. An equity ETF is a basket of stocks. Brokers are now called wealth advisors. Gone are the days when they focused on individual stocks. Now, wealth advisors earn hefty fees for directing clients into ETFs as a means for diversified equity exposure. It’s quite convenient. Retail investors love to own ETFs.
Last week we showed you extreme ETF buying in our post, Record Breakers. Typically, when ETF buying is huge, so is exuberance. And that isn’t good for forward performance.
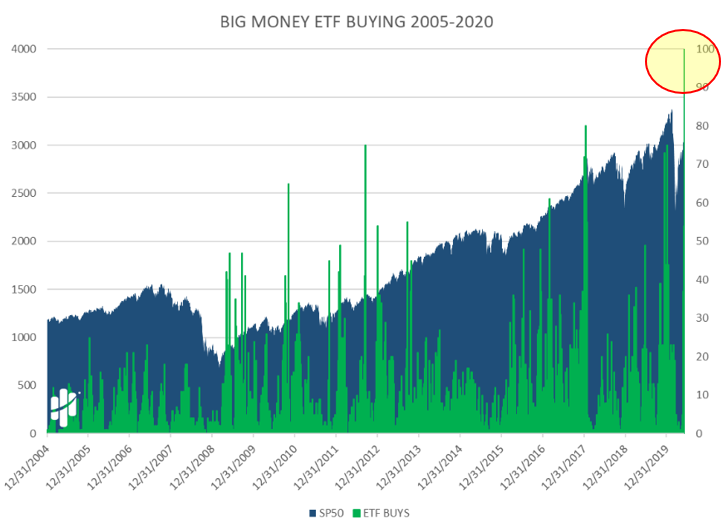
Have a look at the Mapsignals Big Money ETF Index. It tracks daily buys and sells of ETFs. Green bars mean net daily buys. Red bars indicate net sells.
Friday and Monday shattered prior records for buying in ETFs going back since the first ETF (SPY) traded in 1993… I’ve circled that activity and recent prior ETF peaks.
As you can see, after activity like this, markets tend to make their initial descent shortly after:

Let’s keep going. Check out Friday’s big ETF buying compared to the prior 15 years of buys. That’s a big green bar!
Now, I’ll remove a lot of the noise. Below are the days with 50+ ETFs being bought. Those, we define as huge:

Look- mom ’n pop tend to get into the market near crests. History shows it and they are plowing in right now in a record-breaking way. Here is a table of forward returns for the S&P 500 each of the 19 times in the chart above since 2005:
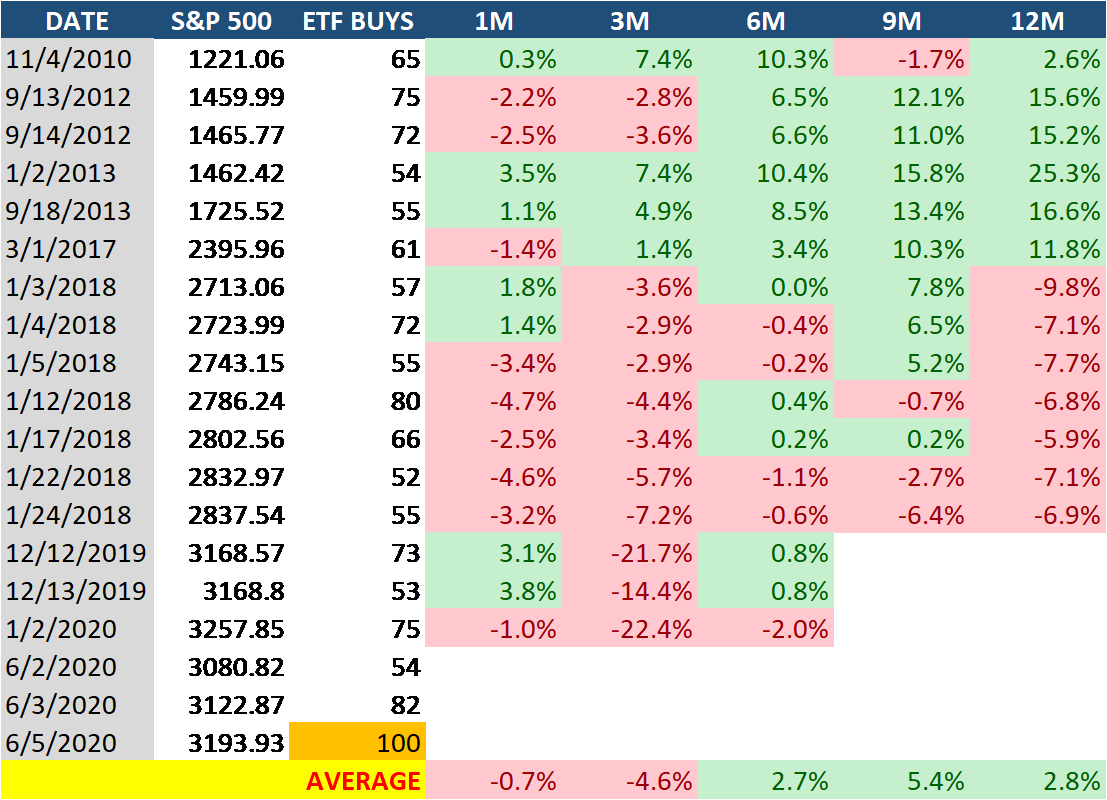
source: Mapsignals, FactSet
Forward returns are not that exciting. In fact, based on this data we can expect a rocky few months ahead…the initial descent.
There are more signs pointing to a near-term market crest.
Buying In Stocks Looks Forced
I’ve seen a lot of things in markets, but nothing like this. Buying in stocks looks forced, meaning there are probably many investors that are short and need to cover OR they suffer from FOMO.
Both positions result in forced buyers.
We’ve talked about overbought markets for weeks…Remember, that’s normal after a huge washout like March.. But, what isn’t normal is insane buying in stocks. It’s rare to see FOMO like this.
Here’s the deal, when ETF buying is epic, monster stock buying usually is too. Below is our daily look at net stock signals. Just like above with ETFs, green bars are buy days and red bars are sell days.
Friday and Monday’s buying crushed prior big green bars by a large margin. This is looking back at our data since 1990:
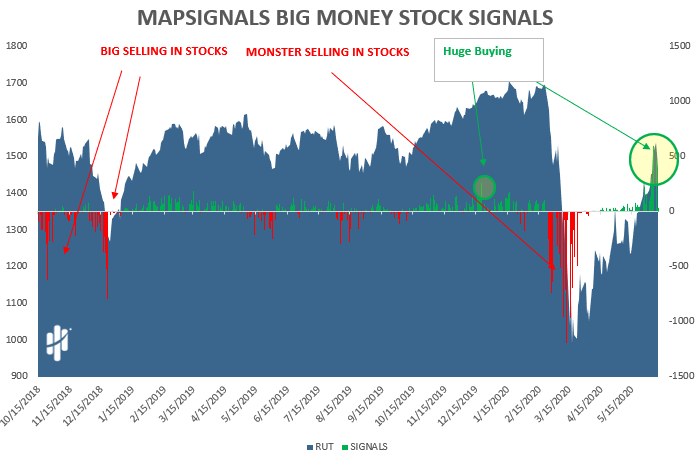
I’ve circled a recent prior big buy day. Notice how the Russell 2000 had trouble breaking higher after that day. That was peak altitude.
I believe a potential shift is very near. But, let’s look at one other data point that confirms the initial descent narrative.
Sector Buying Reaches Prior Peaks
Velocity measures how fast something moves in a given direction. We look at the speed of buying with our sector charts. Momentum exists in bull markets, but too much of anything is a bad thing.
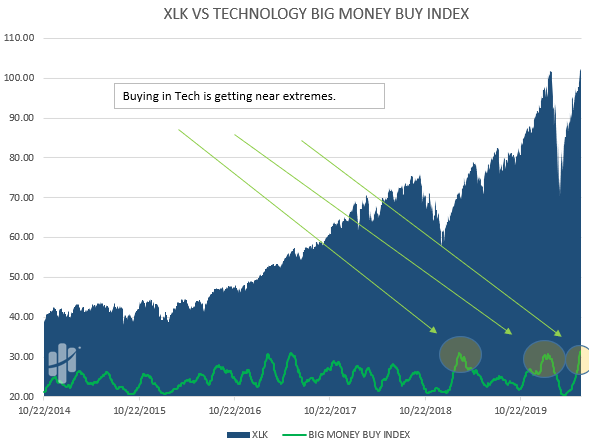
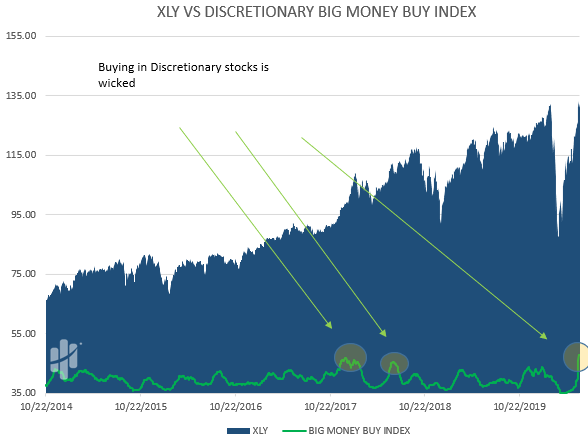
Below we measure the rate of buying in 3 sectors: Technology, Materials, & Discretionary.
When the green line is increasing, the moving average of buys is increasing. Look how right now is near prior momentum peaks. An initial descent in buying should be soon:

Now, predicting the future is hard. But, we have history to guide us. What we see now is eerily similar to prior times just before market tops.
Don’t let that freak you out. It’s actually a good thing. Markets need to cool off. Great buying opportunities rarely happen when everyone is clamoring to buy. They tend to be in environments opposite to now, like when we said to send the marines in March.
Bottom line – we’ve basically performed a duck test on this market. We did the same type of analysis back in January of this year. We didn’t predict a pandemic, we prepared for the initial descent.
Just return your tray tables and seats to their upright position, it could get bumpy on descent.
If you want to hear Mapsignals speak on these observations and more, tune into the MoneyShow tomorrow, Friday June 12th at 2:50 – 3:20PM ET. Our own Jason Bodner will be speaking about finding phoenix stocks rising from the ashes.
Click the image below to register: