• Menu
  • Skip to right header navigation
  • Skip to main content
  • Skip to primary sidebar
  • Skip to footer

MAPsignals

We map big money.

  • Latest Insights
  • Power of MAP
    • MAP Products
    • MAP System
    • MAP White Papers
    • Videos & Interviews
  • Profit with MAP
  • About
    • About MAP
    • MAP Team
    • Authors
    • MAP System
    • MAP Products
    • Big Money Index
  • Members
    • Get Started With MAP
    • My MAP
    • Big Money Charts
    • MAP View
    • MAP View Options
    • MAP Top 20 Weekly
    • MAP 50
    • Member Updates
    • Platinum Updates
    • Members Only Posts
    • Performance
  • Portal

Ear To The Ground

December 3, 2020 //  by Lucas Downey//  9 Comments

Growing up, my dad was a huge Clint Eastwood fan. We had a shelf full of his movies.

A favorite was the Outlaw Josie Wales. I’d watch Josie ride up to a deserted town; the tumbleweeds rolling past the saloon. He took stock of the situation. He’d have his ear to the ground.

Back then, like now, being alert was critical. In order to hear far-off hoof beats of a herd, an incoming posse, or footsteps approaching, cowboys borrowed a Native American method of reconnaissance. No one could pull a fast one on Josie: he’d always have an awareness about him.

Ear to the ground

Markets, like westerns, have no room for surprises Every now and then we enter new territory. This happened a month ago when our data signaled that we have liftoff. We saw indications that markets were heading to all-time highs…and they did. The S&P 500 (SPY ETF) rallied 4.73% since then.

This morning indicated something very different. The Big Money Index reached a new territory: overbought. This is important because it’s our initial signal to be on the lookout for frothy (greedy) market conditions.

History taught us to navigate markets using data. We know that overbought conditions can and often do last for weeks. But more importantly, we have learned to be attentive to 2 critical shifts: blow-off tops and a falling BMI.

Those two things are like the sound of an approaching posse that all cowboys need to be ready for. Getting caught by surprise can be quite costly.

As of now, the BMI data signals more market upside near-term. But at MAPsignals we always have an ear to the ground.

Big Money Index Reaches Overbought

We’ve been very clear about expecting the Big Money Index to rise. The BMI prefaced the pre-election selling. Then it made a hairpin turn and started to rise. Then for weeks, it was fairly flat as that pre-election selling was holding it back. Selling data had yet to roll off.

Remember: The Big Money Index is a 25-trading-day moving average of buying against selling.  Today’s reading still contains data from 25 trading days ago. Tomorrow that data exits.

Well, now that pre-election selling is rolling off, make way for an increasing BMI.

You can see how it pierced overbought levels in this morning’s reading:

big money index ear to the ground

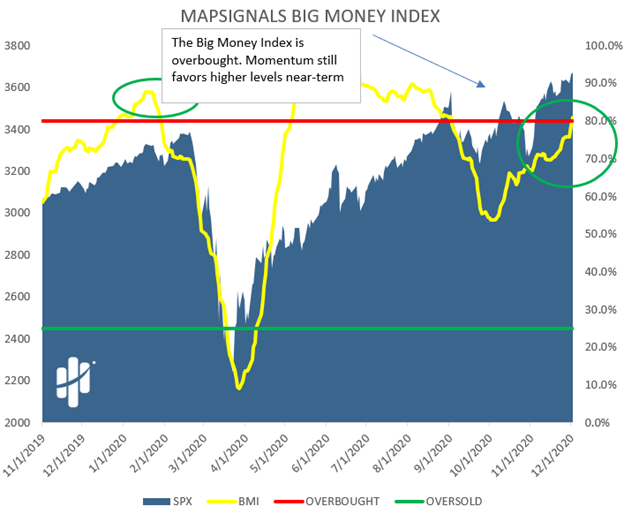
We expect the BMI to rise even more in the coming days as all of that late-October selling will roll off out of the BMI calculation.

As we said earlier, a falling BMI is only one of the critical shifts we lookout for. To be clear, we expect it to rise near-term. That means higher market prices should follow near-term. But now that the BMI is above 80%, we need to alert you that stocks are officially overbought according to MAPsignals metrics.

How do we play that? We are not selling stocks. In fact, we are being methodical with our stock picking right now. Some sectors look more appealing than others, so let’s walk through them…

Ear To The Ground Listening To Big Money Sectors

After looking at the market overall, let’s analyze sectors. Three weeks ago we discussed the rotational rampage in stocks. Certain sectors were juicing, while others were held back.

Reopen stocks should be thought of as stocks that have been beaten down as COVID-19 brought them to their knees. Think along the lines of travel, leisure, theaters, retail, & restaurants. They have had terrible earnings for obvious reasons.

But now, many reopen sectors are at, or approaching, extreme levels of buying. Vaccines imminently arriving are boosting investor confidence and lifting these stocks to new recent highs. Our ear to the ground tells us to be very selective with certain groups.

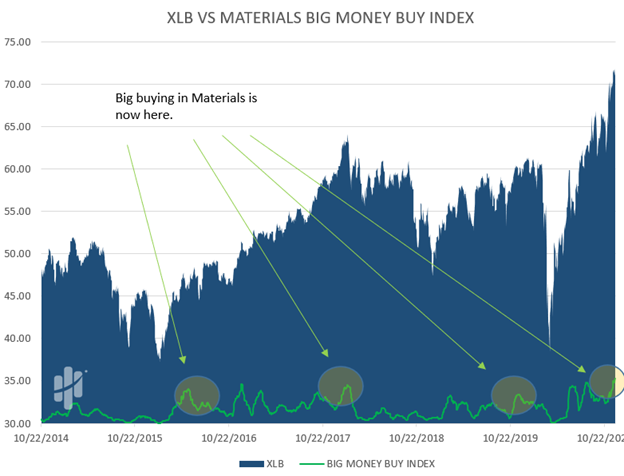
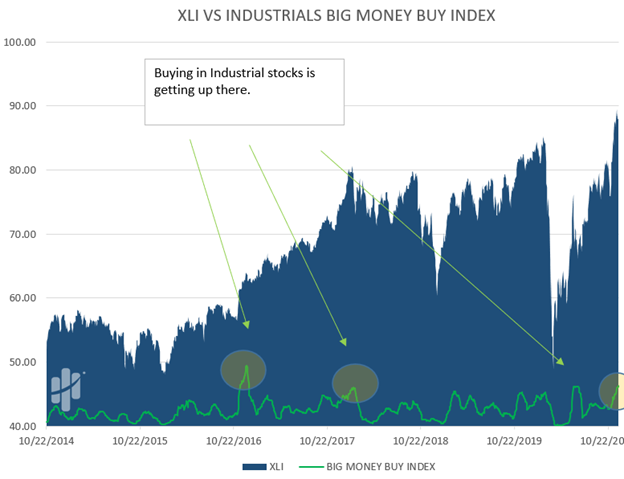
Below shows our measures of sector buying. A rising green line means buying momentum is rapidly increasing. And that’s happening in almost every sector… almost.

Shockingly, buying in Material stocks is at the highest point in 6 years!

extreme buying material stocks

Industrial stocks are approaching prior heights:

extreme buying industrial stocks

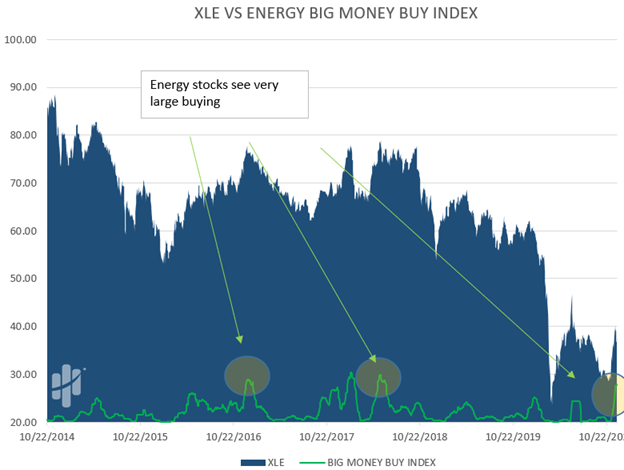
Even energy is seeing big buying:

extreme buying energy stocks

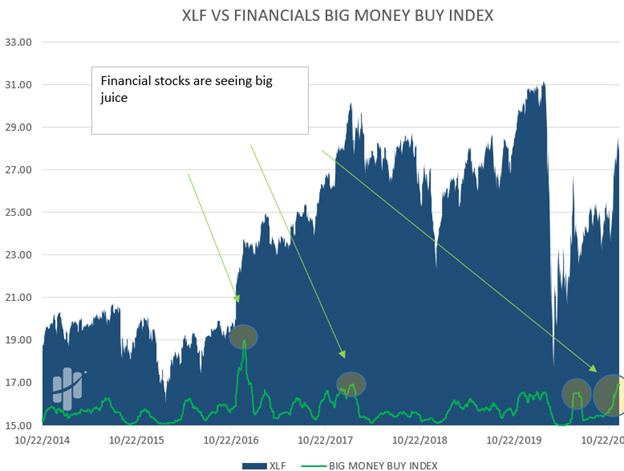
Financial stocks have the juice:

extreme buying financial stocks

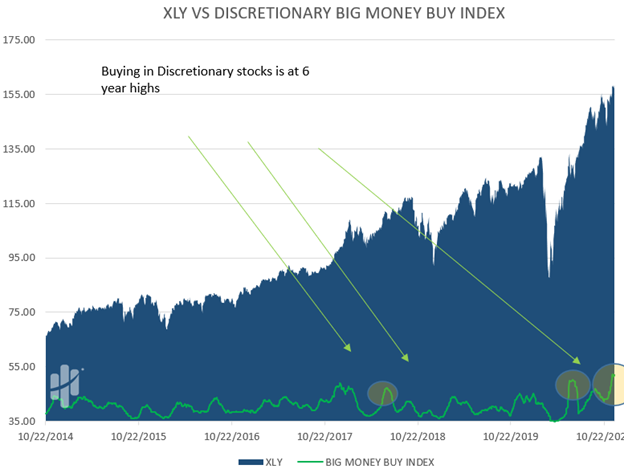
Discretionary stock buying is also at 6-year highs!

extreme buying discretionary stocks

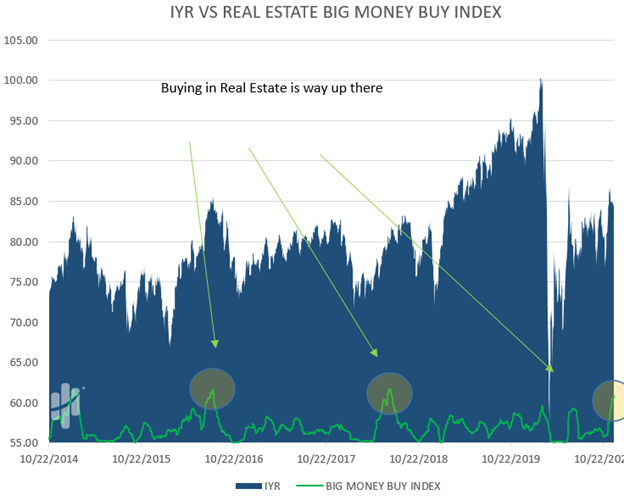
Finally, Real Estate is getting gobbled up:

extreme buying real estate stocks

This data tells us here, that the reopen trade is a bit extended. We’d be cautious initiating new buys on stocks like these.

Now, before you start thinking our arrival into overbought along with these overheated sectors means it’s time to sell stocks, remember we said almost every sector.

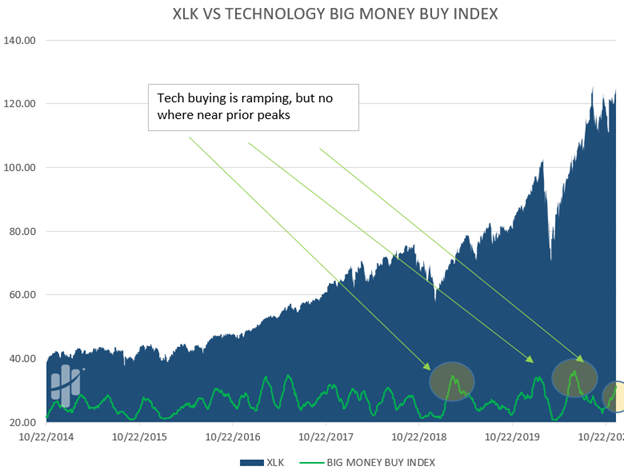
Let’s look at Technology and Healthcare.

Unlike the sectors above, Tech stocks are not near a prior buying peak:

Technology sector buying

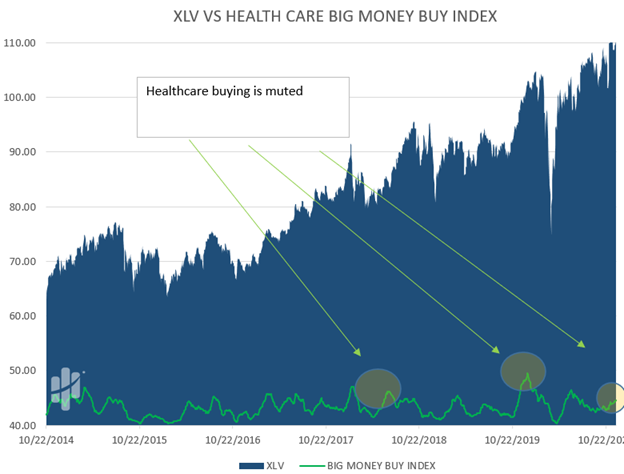
Neither is Healthcare:

Healthcare sector buying

So, what does this tell us?

Prior beaten down sectors making little in revenue and earnings are at frothy levels. Technology and Healthcare with great fundamentals (which kept the market afloat during COVID-19)- are not.

When markets crest, typically animal spirits boost ALL sectors with unsustainable buying.

That brings us to the 2nd piece of data we need to keep an ear out for: a blow-off top. Investopedia defines a blow-off top as “a chart pattern that shows a steep and rapid increase in a security’s price and trading volume followed by a steep and rapid drop in price usually on significant or high volume as well.”

Generally, a blow-off top is the final gasp of greed before a market correction. When that happens, all sectors will be getting the love and so will ETFs.

Speaking of ETFs…

ETFs See Monster Buying In November

There’s big buying and there’s monster buying.

The re-risking that markets have seen the past month is eye-popping. Re-risking means the reallocation of capital: in this case, out of growth and tech stocks and into value and former class clowns. MAPsignals has been all over this rotational re-risking giving you the play-by-play.

Indications of capital inflows are also visible in ETFs. Recently, a report said November was the largest equity ETF inflow for a month… ever.

We aren’t surprised. Our ear to the ground heard the buyers stampede well in advance of any headline you’ll read today.

Below is the Big Money ETF Index. It nets the daily big money buys and sells. Circled off to the right is the buying in November:

November ETF Buying Was Immense

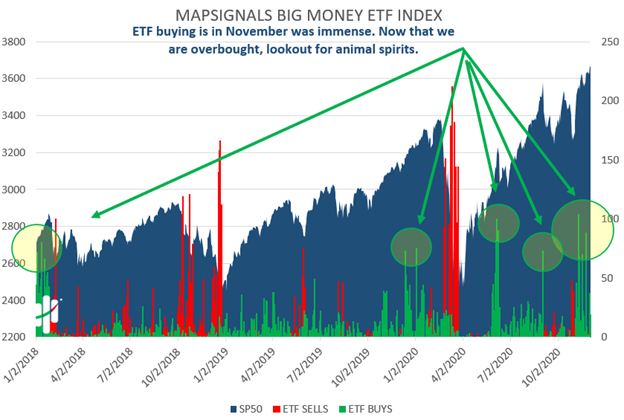
The green arrows point to prior times when ETF buying was immense. Those times often precede market pullbacks. A blow-off top in our data is a day (or couple of days) of incredible buying alongside an overbought market.

Remember, this morning the market went overbought.

So, let’s bring it all home: The first signs of froth have arrived, but there is still likely more room for stocks to rise. As we cross into new territory, we must keep our ear to the ground for excessive greed. That will be our clear signal a selling stampede is near.

It’s like the setup of an old Western movie: everything seems fine until danger strikes.

Don’t be caught off guard. For now, we follow the trend, but sometime soon our tune will change.

And when it does, ask yourself the words of the Outlaw Josie Wales:, “Well, ya gonna pull those pistols or whistle Dixie?”

Lucas Downey
Lucas Downey

Lucas is co-founder of MAPsignals. His full bio can be found here.
Prior to MAP, he was Head of ETF Sales at Cantor Fitzgerald & SVP of Derivatives at Jefferies, LLC.

Spread the word!

Category: All, Big Money Insights Weekly

Previous Post: «EMBARRASSEMENT OF RICHES Embarrassment Of Riches
Next Post: The Investing Bonus Level big money podcast»

Reader Interactions

Comments

  1. Jeremy

    December 3, 2020 at 11:18 am

    We slackin’ on CRM now?

    Reply
    • MAPsignals Staff

      December 3, 2020 at 11:29 am

      What do you mean?

      Reply
      • MAPsignals Staff

        December 3, 2020 at 11:41 am

        WOW! Too much data sifting this morning. That flew over my head.

        You are getting a bonus point for that one!

        Reply
        • Jeremy

          December 3, 2020 at 11:42 am

          Hehe 😛

          Reply
      • Jeremy

        December 3, 2020 at 11:41 am

        I know MapSignals is a shareholder of CRM (SalesForce) and recommends it. I have faith in MapSignals as having the juice to identify stocks with some of the most potentially-erumpent growth.. just wondering how you guys still felt about SalesForce, and whether the recent Slack acquisition changes anything for you. Cramer seems to think it’s still a buy, and SalesForce just feels like a better program to me then Microsoft Dynamics. But $27 Billion is a lot to pay for an acquisition… Sorry for the pithy nebulousness. #MAPJuice

        Reply
        • MAPsignals Staff

          December 3, 2020 at 11:42 am

          I’ll shoot you an email.

          Reply
  2. Greg H.

    December 3, 2020 at 5:09 pm

    Thank you; great info! Completely agree and proceeding with caution. However, I think I’ll take a look at the “former class clown” stocks. Thank you for your time.

    Reply
  3. Stan

    December 5, 2020 at 2:51 pm

    Great report guys! I took some profits this Friday before the close on a few positions but still have most of my irons in the fire–but watching them extremely closely. Your analysis and the BMI is really helpful in doing this. I’ll be glad once the Jan 5 Georgia run-offs, and the uncertainty, are over with. Between that and overbought conditions one really needs to have an ear to the ground. BTW, hopefully we’ll have a new Podcast episode coming out soon??

    Reply
    • MAPsignals Staff

      December 5, 2020 at 4:01 pm

      Hey Stan – thanks for the kindness.

      The runoffs will certainly be in focus. We will be on the lookout for that as well.

      Hopefully we can get another podcast going soon. Ideally, we want to generate content when there’s something to say…maybe being overbought is worth a chat 🙂

      Reply

Leave a Reply Cancel reply

Your email address will not be published. Required fields are marked *

Primary Sidebar

Get Big Money Insights for FREE

Want to know where the Big Money is headed?

Just enter your email address below. You'll get our FREE NEWSLETTER sent directly to your inbox.

We call it Big Money Insights... It’s your weekly sneak peek at the powerful market-moving forces that are hidden from 99% of investors.

"*" indicates required fields

This field is for validation purposes and should be left unchanged.

Categories

  • All
  • Big Money Insights Weekly
  • Big Money Series
  • Macro Insights
  • MAP In The Media
  • Members Only
  • Performance
  • Podcast
  • Special Reports
  • Stocks
  • Videos & Interviews
  • White Papers

Archives

  • February 2023
  • January 2023
  • December 2022
  • November 2022
  • October 2022
  • September 2022
  • August 2022
  • July 2022
  • June 2022
  • May 2022
  • April 2022
  • March 2022
  • February 2022
  • January 2022
  • December 2021
  • November 2021
  • October 2021
  • September 2021
  • August 2021
  • July 2021
  • June 2021
  • May 2021
  • April 2021
  • March 2021
  • February 2021
  • January 2021
  • December 2020
  • November 2020
  • October 2020
  • September 2020
  • August 2020
  • July 2020
  • June 2020
  • May 2020
  • April 2020
  • March 2020
  • February 2020
  • January 2020
  • December 2019
  • November 2019
  • October 2019
  • September 2019
  • August 2019
  • July 2019
  • June 2019
  • May 2019
  • April 2019
  • March 2019
  • February 2019
  • January 2019
  • December 2018
  • November 2018
  • October 2018
  • September 2018
  • August 2018

Follow us on Twitter

MAPsignals Follow 1,434 1,061

MAPsignals is a data platform that tracks institutional money flows in stocks and ETFs. Sign up for free insights here: https://t.co/SaAVHjKC9J

mapsignals
mapsignals avatar; MAPsignals @mapsignals ·
58m 1621476848990359552

Pendulum has swung

Helene Meisler @hmeisler

Highest volume for the QQQs since 12/13

Reply on Twitter 1621476848990359552 Retweet on Twitter 1621476848990359552 0 Like on Twitter 1621476848990359552 0 Twitter 1621476848990359552
Load More...

Footer

© 2021 Mapsignals.com

  • Home
  • Contact & Disclaimer
  • Privacy Policy
  • Terms & Conditions
  • Opt-out preferences
  • FAQ

Copyright © 2023 · Mai Law Pro on Genesis Framework · WordPress · Log in

✕
What Happened to Risk Assets White Paper is Here

Get your copy here and take a journey through our thoughts on margin and leverage.

Enter your email address below and you'll get our FREE NEWSLETTER sent directly to your inbox. 

 We call it Big Money Insights... It’s your weekly sneak peek at the powerful market-moving forces that are hidden from 99% of investors.

MAPsignals
Manage Cookie Consent
We use cookies to optimize our website and our service.
Functional Always active
The technical storage or access is strictly necessary for the legitimate purpose of enabling the use of a specific service explicitly requested by the subscriber or user, or for the sole purpose of carrying out the transmission of a communication over an electronic communications network.
Preferences
The technical storage or access is necessary for the legitimate purpose of storing preferences that are not requested by the subscriber or user.
Statistics
The technical storage or access that is used exclusively for statistical purposes. The technical storage or access that is used exclusively for anonymous statistical purposes. Without a subpoena, voluntary compliance on the part of your Internet Service Provider, or additional records from a third party, information stored or retrieved for this purpose alone cannot usually be used to identify you.
Marketing
The technical storage or access is required to create user profiles to send advertising, or to track the user on a website or across several websites for similar marketing purposes.
Manage options Manage services Manage vendors Read more about these purposes
View preferences
{title} {title} {title}