• Menu
  • Skip to right header navigation
  • Skip to main content
  • Skip to primary sidebar
  • Skip to footer

MAPsignals

We map big money.

  • Latest Insights
  • Power of MAP
    • MAP Products
    • MAP System
    • White Papers
    • Videos & Interviews
  • Profit with MAP
  • About
    • About MAP
    • MAP Team
    • Authors
    • MAP System
    • MAP Products
    • Big Money Index
  • Members
    • Get Started With MAP
    • My MAP
    • Big Money Charts
    • MAP View
    • MAP View Options
    • MAP Top 20 Weekly
    • MAP 50
    • Member Updates
    • Platinum Updates
    • Members Only Posts
    • Performance
  • Portal

Further Upside for Stocks

July 21, 2022 //  by Lucas Downey//  Leave a Comment

When investors give up on stocks, there’s usually opportunity.

That’s been our message the last month. Recently, our data is signaling less selling in stocks. Slowly the market is becoming more constructive. This could signal further upside for stocks.

Further Upside for Stocks

What a difference a week makes. Just as investors were digesting an awful June CPI print where inflation rose 9.1% year-over-year, our data was pointing to a contrarian bullish setup. Our Big Money Index was reaching oversold conditions. Historically, that’s a great time to buy stocks if you’re a long-term investor.

The rare green zone triggered on Friday morning and since then stocks have blasted higher. And while this is positive on the surface, there’s more to this rally than meets the eye.

As I’ll show you, institutional investors have dialed back their equity risk to levels indicating peak pessimism. Not only that, some of the weakest areas of the market year to date are beginning to lead. I know it’s not popular to say, but there’s a case for further upside for stocks…at least near-term.

Let’s first jump into the data.

Oversold Signal Triggers Rally

There are periods when selling gets overdone. Often, those moments can trigger a relief rally like a coiled spring being released. Last Friday, our Big Money Index (BMI) briefly dipped into oversold territory.

The BMI tracks our daily buy and sell signals on a 25-day moving average. Reaching 25% (oversold) means that over the prior 5 weeks, only 25% of our signals have been buyers. That’s rare.

We didn’t stay oversold for long. Stocks have ramped in a big way since.

Below I’ve circled Friday’s oversold signal and May 24th’s oversold signal. Both prefaced a strong relief rally:

BMI briefly hit oversold last Friday. Markets then staged a rally.

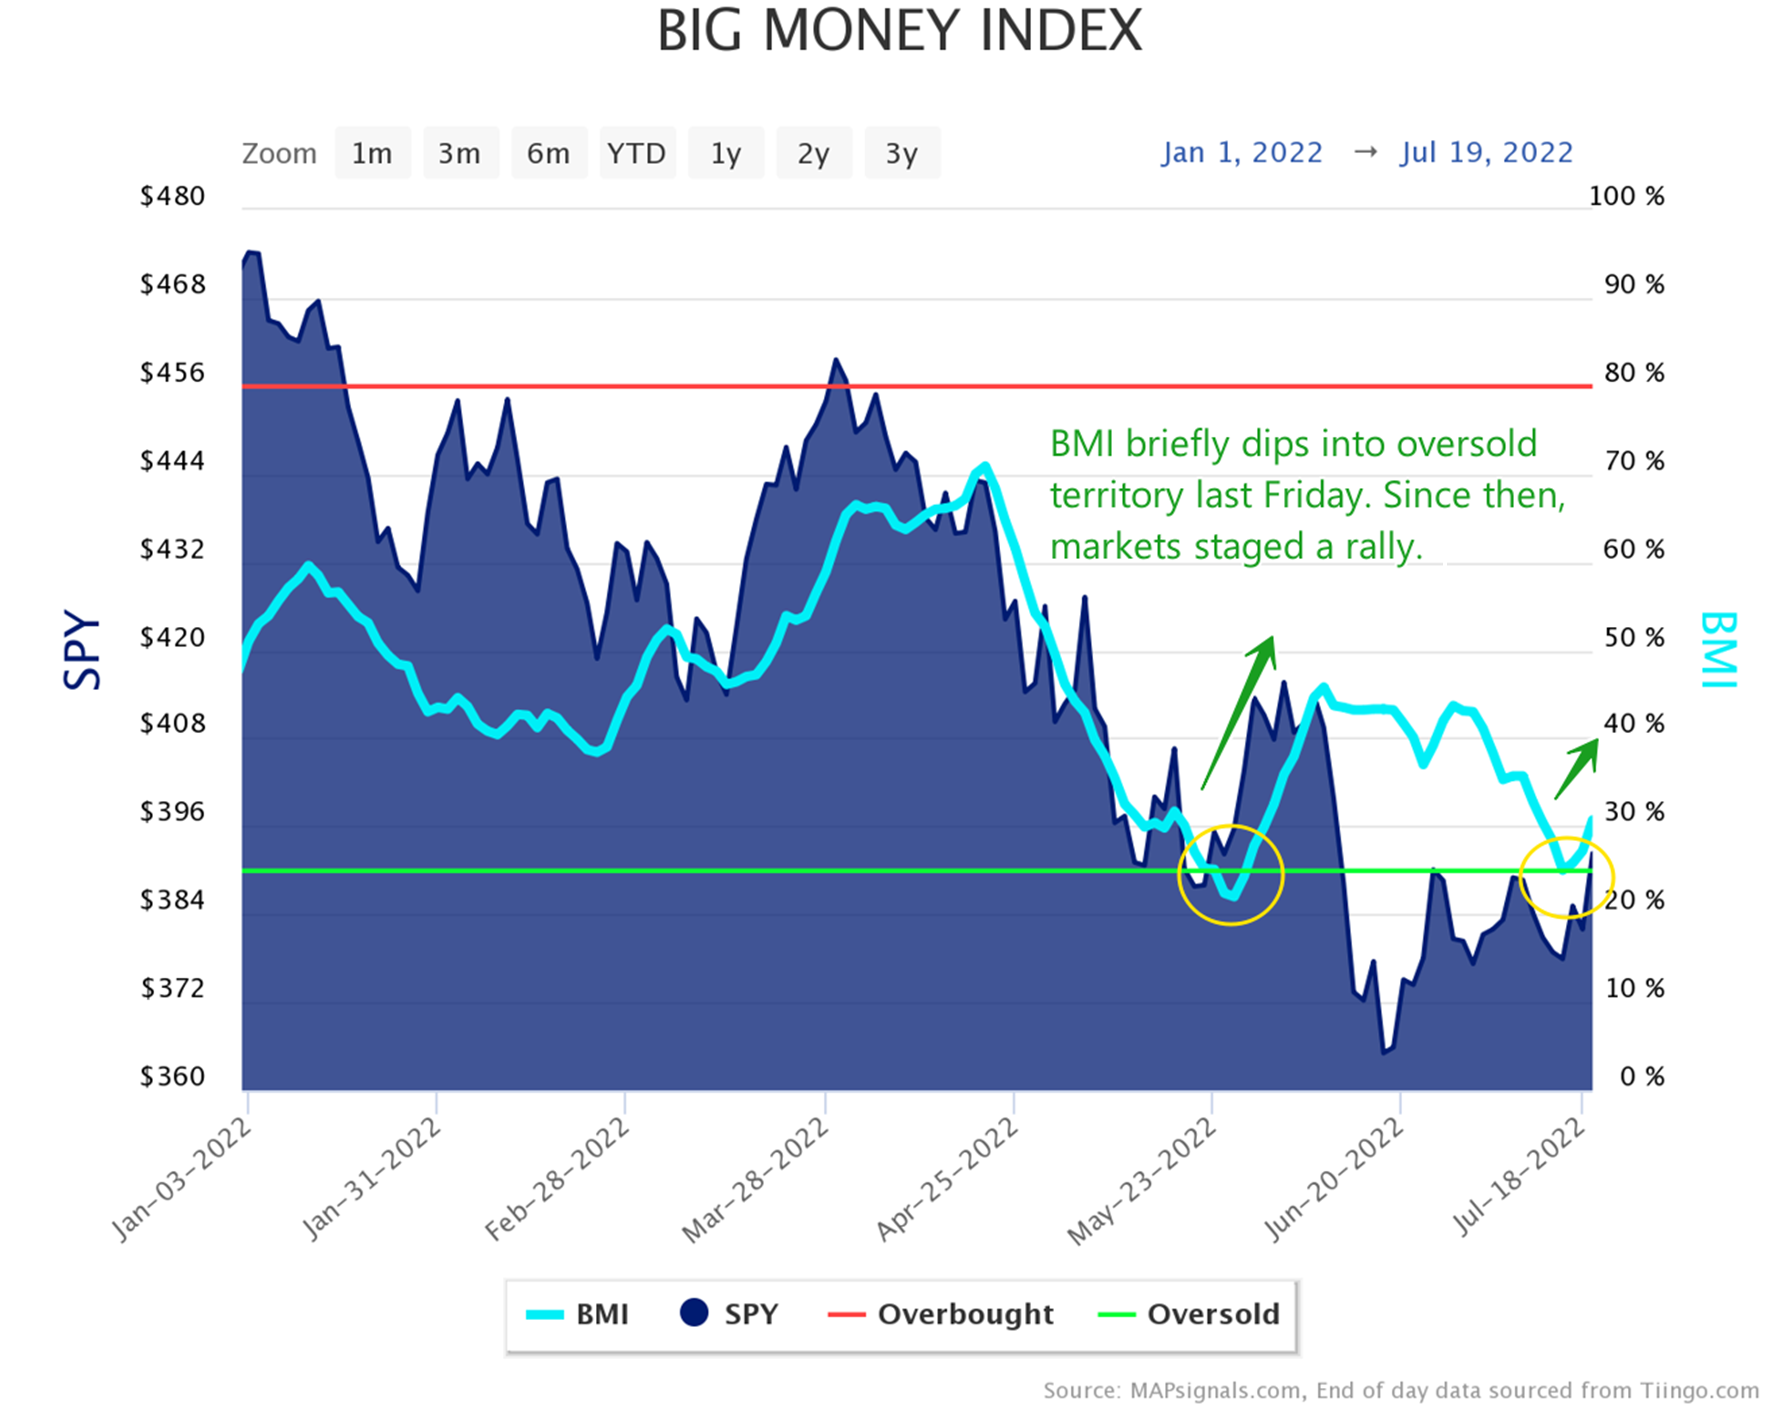
As of this writing, the S&P 500 is up 4.3% since Thursday’s close. As you can see above, the BMI has been rapidly climbing. That’s due to selling slowing.

At MAPsignals, we believe stocks and markets move due to one force: supply and demand. Registering extreme bearish readings in our data indicates sellers have been in control YTD. To illustrate how ugly the selling has been, check out the Big Money Stock Buys and Sells Chart.

These are the daily total of buys and sells in our data. In 2022, incredibly just over 70% of signals have been sells:

In 2022, 7 out of 10 sell signals trigger 2 oversold readings | Big Money stock buys and sells

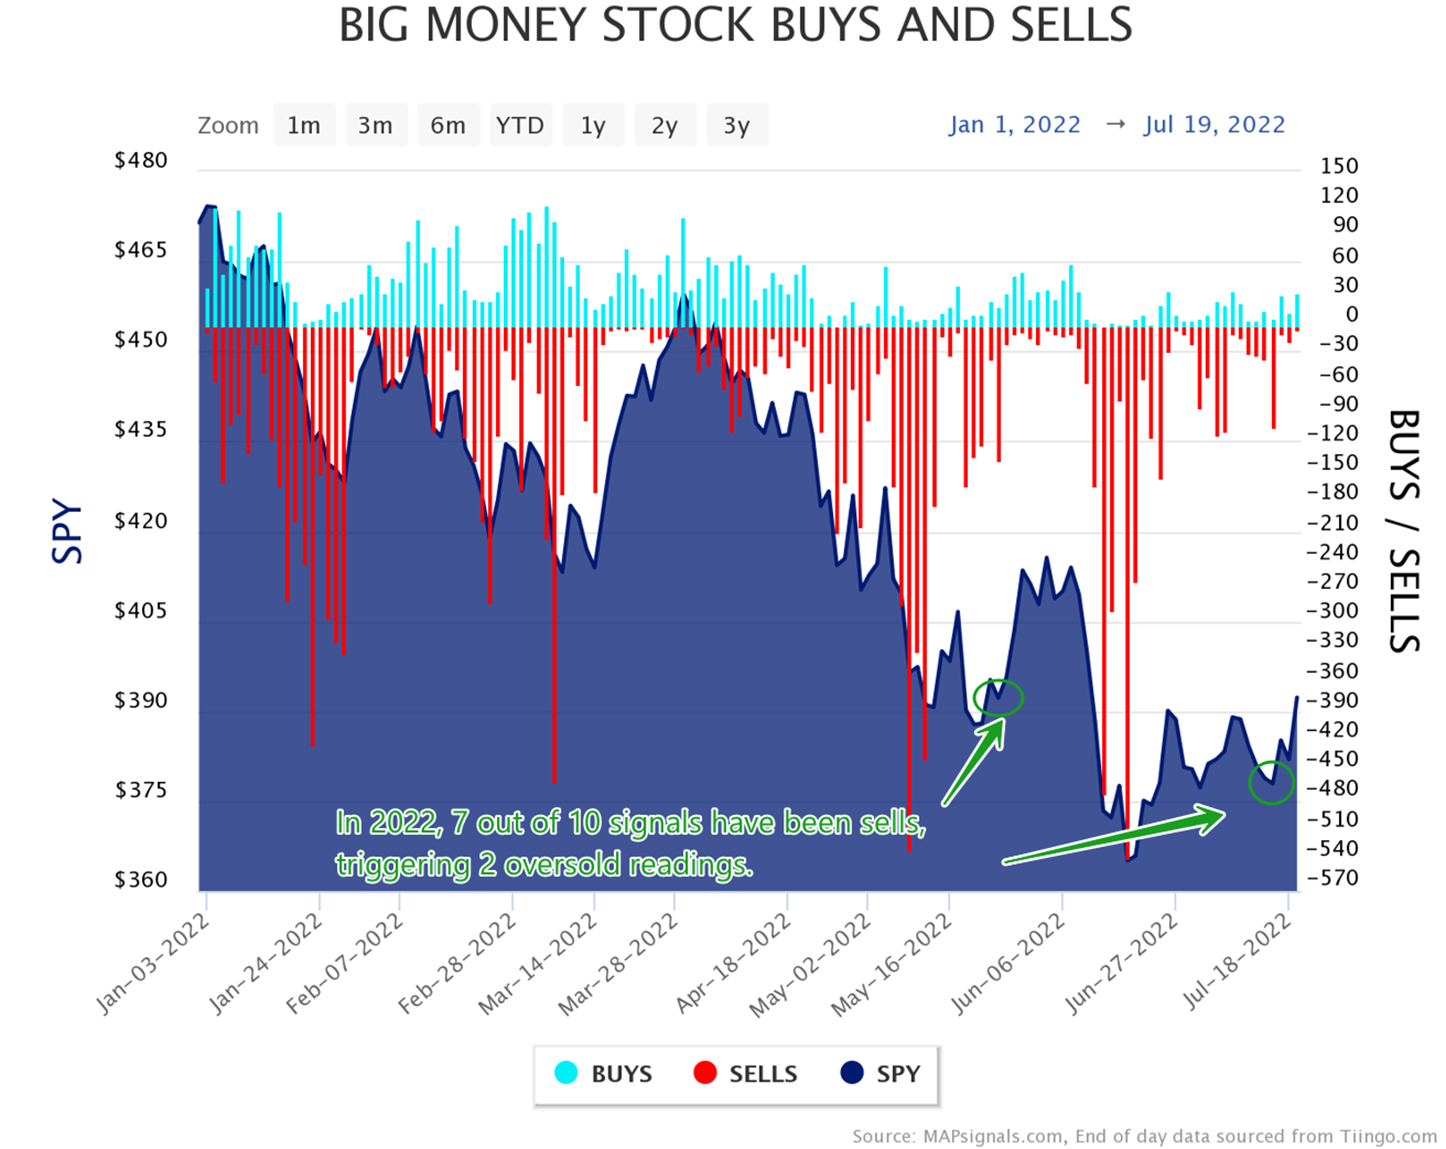
That’s a lot of red. When sellers outnumber buyers 2 to 1, it’s logical that prices fall. And this data lines up with a recent survey out of Bank of America. This week they released a chart showing how investor allocation to stocks fell to an area nearing 2008 levels:

Net percent taking higher than normal risk levels | Bank of America

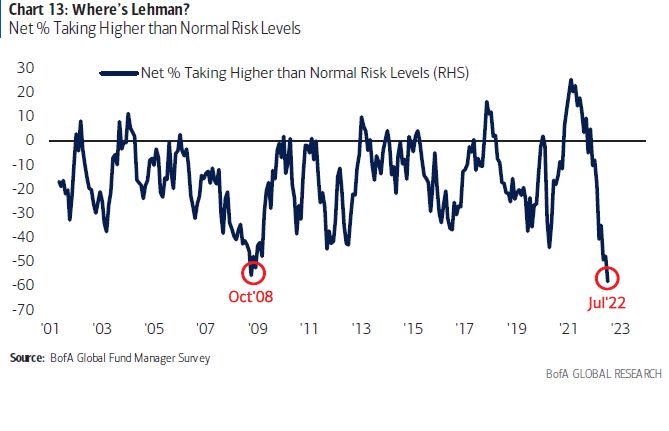
This aversion to risk has clearly been a driver of the bear market. And in times of despair, I find it important to be proactive.

Two hard hit areas are beginning to show signs of life.

Further Upside for Stocks

So now let’s look at further bullish signs for stocks.

A few weeks ago, I made the case for two sectors primed for upside. Some of the hardest hit areas of the market were discretionary and technology stocks.

Both groups have faced relentless selling due to soaring inflation and rising interest rates. As I showed, up until June, nearly 9 out of 10 signals in those sectors were sell signals. Extreme bearishness is an understatement.

Since the market lows made on June 16th, both sectors have staged an impressive rally. In just over a month, the Consumer Discretionary Select Sector SPDR Fund (XLY) which is a great proxy for the discretionary sector, has ramped 13.36% vs the market’s climb of 7.48%:
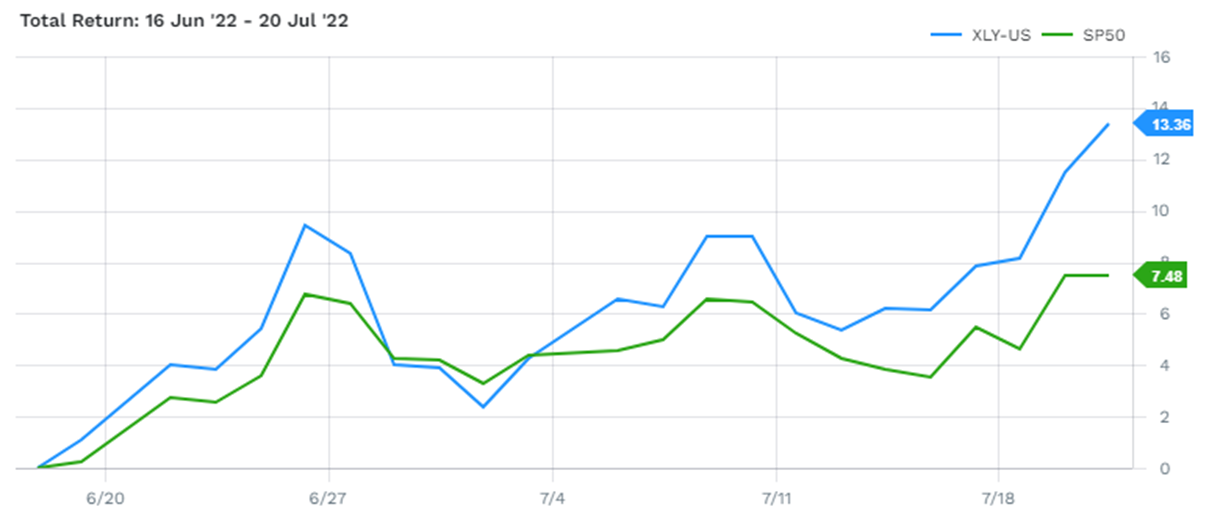
Select Sector SPDR Fund (XLY) has ramper 13.36% vs market's climb of 7.48%
Source: FactSet

Now take a look at the tech space. The Technology Select Sector SPDR Fund (XLK) has ripped 11.66% since the market made lows:
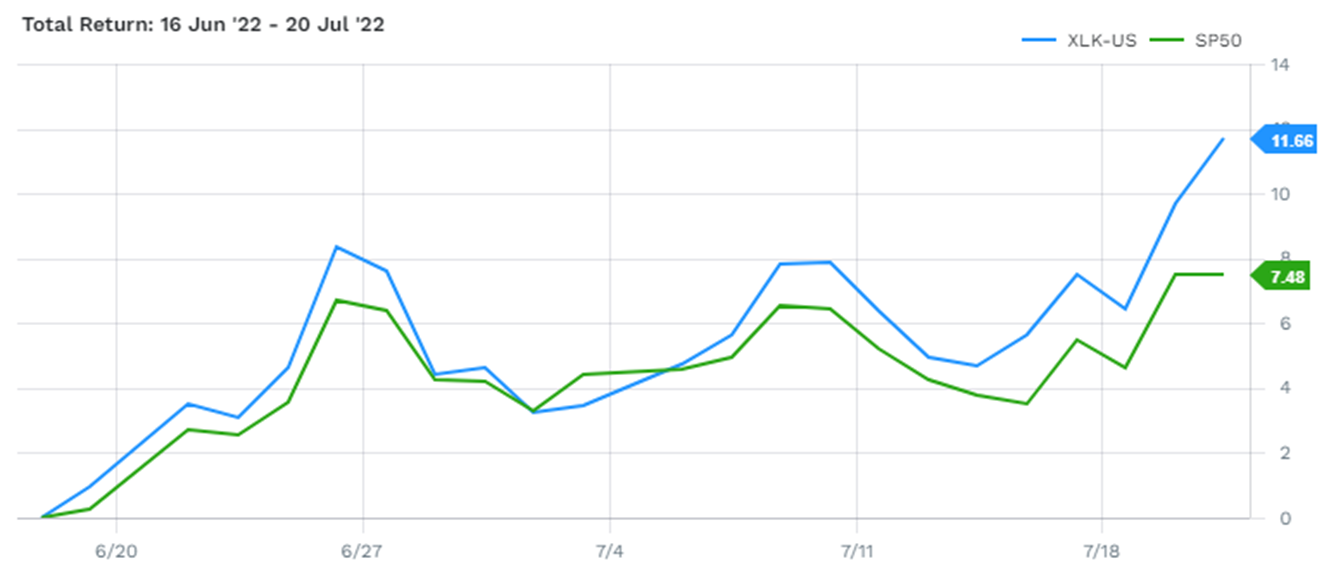
Technology Select Sector SPDR Fund (XLK) has ramped 11.66% since the market lows
Source: FactSet

When some of the weakest areas of the market begin to lead, pay attention. We could be looking at a rotation into more growthier groups in the coming days and weeks.

And this is spot on with Alec Young’s recent views to buy growth over value. I couldn’t agree more!

If markets keep heading higher, our data could slowly show buyers stepping in. And what a welcome change that would be.

When it’s time to buy, it’s usually when all hope is lost. Finally, signs are favoring the bulls!

Let’s wrap up.

Here’s the bottom line: We may have reached peak bearishness over the near-term. An oversold Big Money Index coupled with historically low investor appetite for stocks, creates a cocktail for higher stock prices.

New leadership is emerging in some of the hardest hit areas of the market: Discretionary and Technology stocks are rallying hard. Plenty of high-flying growth stocks are beginning to awaken.

All that’s left to give me high conviction is solid buying in our data.

If the macro headwinds begin to take a backseat, odds are we’ll see prior growth leaders getting bought.

A few names are already seeing green. That signals further upside for stocks.

***If you’re wanting to follow our Big Money signals in the coming days, get started with a MAPsignals subscription. In our portal you’ll have access to the Big Money Index, stocks, ETFs, and more. Let data help inform your investing.

Lucas Downey
Lucas Downey

Lucas is co-founder of MAPsignals. His full bio can be found here.
Prior to MAP, he was Head of ETF Sales at Cantor Fitzgerald & SVP of Derivatives at Jefferies, LLC.

Spread the word!

Category: All, Big Money Insights Weekly

Previous Post: «Best Undervalued Stocks for August 2022 Best Undervalued Stocks for August 2022
Next Post: 4 Best ETFs to Buy in a Recession for 2022 4 Best ETFs to Buy in a Recession for 2022»

Reader Interactions

Leave a Reply Cancel reply

Your email address will not be published. Required fields are marked *

Primary Sidebar

Get Big Money Insights for FREE

Want to know where the Big Money is headed?

Just enter your email address below. You'll get our FREE NEWSLETTER sent directly to your inbox.

We call it Big Money Insights... It’s your weekly sneak peek at the powerful market-moving forces that are hidden from 99% of investors.

"*" indicates required fields

This field is for validation purposes and should be left unchanged.

Categories

  • All
  • Big Money Insights Weekly
  • Big Money Series
  • Macro Insights
  • MAP In The Media
  • Members Only
  • Performance
  • Podcast
  • Special Reports
  • Stocks
  • Videos & Interviews
  • White Papers

Archives

  • August 2022
  • July 2022
  • June 2022
  • May 2022
  • April 2022
  • March 2022
  • February 2022
  • January 2022
  • December 2021
  • November 2021
  • October 2021
  • September 2021
  • August 2021
  • July 2021
  • June 2021
  • May 2021
  • April 2021
  • March 2021
  • February 2021
  • January 2021
  • December 2020
  • November 2020
  • October 2020
  • September 2020
  • August 2020
  • July 2020
  • June 2020
  • May 2020
  • April 2020
  • March 2020
  • February 2020
  • January 2020
  • December 2019
  • November 2019
  • October 2019
  • September 2019
  • August 2019
  • July 2019
  • June 2019
  • May 2019
  • April 2019
  • March 2019
  • February 2019
  • January 2019
  • December 2018
  • November 2018
  • October 2018
  • September 2018
  • August 2018

Follow us on Twitter

MAPsignals Follow 729 859

MAPsignals is a data platform that tracks institutional money flows in and out of the market.

mapsignals
mapsignals avatar; MAPsignals @mapsignals ·
12 Aug 1558112619738943489

There it is. $ARKK The ARK Innovation ETF saw its first buy signal in 2022 -

Image for the Tweet beginning: There it is. $ARKK The Twitter feed image.
Reply on Twitter 1558112619738943489 Retweet on Twitter 1558112619738943489 1 Like on Twitter 1558112619738943489 7 Twitter 1558112619738943489
Load More...

Footer

© 2021 Mapsignals.com

  • Home
  • Contact & Disclaimer
  • Privacy Policy
  • Terms & Conditions
  • Cookie Policy (US)
  • FAQ

Copyright © 2022 · Mai Law Pro on Genesis Framework · WordPress · Log in

✕
What Happened to Risk Assets White Paper is Here

Get your copy here and take a journey through our thoughts on margin and leverage.

Enter your email address below and you'll get our FREE NEWSLETTER sent directly to your inbox. 

 We call it Big Money Insights... It’s your weekly sneak peek at the powerful market-moving forces that are hidden from 99% of investors.

Manage Cookie Consent
We use cookies to optimize our website and our service.
Functional Always active
The technical storage or access is strictly necessary for the legitimate purpose of enabling the use of a specific service explicitly requested by the subscriber or user, or for the sole purpose of carrying out the transmission of a communication over an electronic communications network.
Preferences
The technical storage or access is necessary for the legitimate purpose of storing preferences that are not requested by the subscriber or user.
Statistics
The technical storage or access that is used exclusively for statistical purposes. The technical storage or access that is used exclusively for anonymous statistical purposes. Without a subpoena, voluntary compliance on the part of your Internet Service Provider, or additional records from a third party, information stored or retrieved for this purpose alone cannot usually be used to identify you.
Marketing
The technical storage or access is required to create user profiles to send advertising, or to track the user on a website or across several websites for similar marketing purposes.
Manage options Manage services Manage vendors Read more about these purposes
View preferences
{title} {title} {title}