
Pay Me Now Or Pay Me Later
An old-school bond trader used to buy big when markets were chaotic. He wasn’t worried about picking the low: He focused on making good bets.
Routinely after helping out a forced seller, he’d hang up the phone and say, “Pay Me Now Or Pay Me Later!” Then he’d quietly smirk.
His years of trading taught him to put the odds in his favor when making markets for clients. As long as he was comfortable owning the asset at a discount (or perceived value), he didn’t really care if it bounced the next day or in the coming weeks.
It was all about making smart bets.
Back then he’d rely on his instinct. He’d smell blood in the water, then strike…fast.
And this strategy didn’t win all the time. Nothing does. But more often than not, he’d get some bargains. And those winners would more than make up for the losers…over time.
Which brings me to today’s market environment. As we pointed out weeks ago, summers are notoriously volatile… Which led to the Big Money Index falling like a rock.
Up until this week, sellers have been gaining ground on the buyers. Which, as I’ll show you, came to a climax on Monday. In fact, Monday was the largest day of selling in stocks and ETFs since the pandemic lows in March 2020!
Looking at our data, bullish signs are emerging. Sellers are evaporating.
For investors looking to buy stocks, the question may be “is this a pay me now or pay me later kind of market?” Our data has us believing it’s the former.
Let me show you what I mean.
Big Money Index Pay Me Now Or Pay Me Later
This past week has been incredible in terms of data. It’s important to start from the top then work our way down.
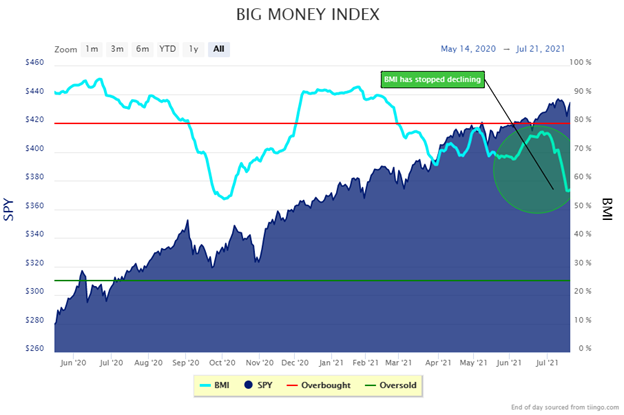
The Big Money Index has been a one-way train lower for weeks. Stock sellers were increasing as buyers were decreasing.
But, that stopped after Monday’s selloff. Sellers evaporated and buyers suddenly showed up. This caused the BMI to stop falling.
On the margin this is bullish. Typically, whichever way the BMI goes, the markets follow.
So, does the BMI’s pause signal that stocks are ready to climb? To us, it does… lows for the market look to be in…for now:
But the next few charts will tell the story of why we are way more bullish today than we were last week.
As a reminder, our data is all about following the Big Money. If buyers are increasing, get bullish. If sellers are gaining, get less bullish.
BUT, there are times when stock and ETF selling is so extreme that a near-term bounce is likely. And that’s what we saw on Tuesday morning, reviewing Monday’s selloff.
Below is our Big Money Stock Buys & Sells chart. I’ve circled Monday’s selloff. But more importantly, look how prior big selling days tend to be near the local lows of the market.
Monster days of stock selling usually brings a relief rally. That means, expect JUICE after big nasty red days:
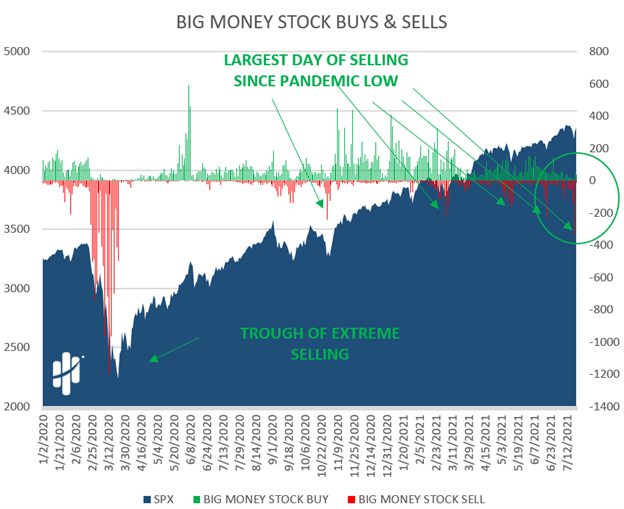
Looking at this chart, is this a pay me now or pay me later kind of setup? To us, these washouts suggest it won’t take long for stocks to rip higher.
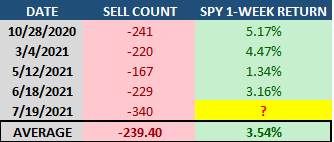
The prior 4 times we’ve seen large selling (arrows above), the market ramped like a rocket a week later:
Only time will tell if that’ll be the case this go round.
But you know the deal. When you focus on owning outlier stocks, whether you buy at the right time or not…they tend to go UP over the long-run. And there’s been buying in outlier stocks since Monday. Breadth is increasing…i.e., don’t get too bearish!
But let’s look at another chart suggesting a bullish tone.
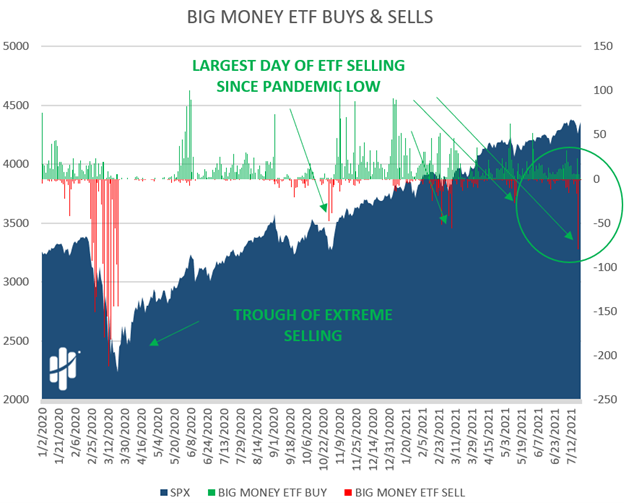
Since ETFs are baskets of stocks, it stands to reason that big sell days line up with near-term lows. That’s exactly what this next chart shows. Below is our Big Money ETF Buys & Sells chart.
Look how nasty the selling was on Monday. More importantly, look how prior red days usually line up with market lows:
Subscribers can track our ETF buys and sells chart and the BMI in real-time here.
So I’ll ask the question again, does this look like a pay me now or pay me later kind of market? Our data is leaning more towards now than later.
So, let’s wrap this up.
Here’s the bottom line: The data is leaning bullish for stocks. The Big Money Index has stopped falling and extreme selling in stocks & ETFs tends to mark near-term market bottoms. If history is any guide, look for new highs in the near future.
Subscribers looking for our best stocks to play for a bounce, check out July’s Top 50 report.
Look, summers tend to bring lots of volatility. Use it to your advantage. On nasty sell-off days, we like to be like the old-school bond trader. We put our heads down and go to work.
In a way we want to help those panicked sellers! After all, they need someone to sell to.
We choose to buy outlier stocks when the crowd is dumping. And when we get fire-sale prices, we gladly say, pay me now or pay me later!
History says betting on outliers is a winning strategy if you’re patient. Just focus on the best ones out there…the Big Money magnets.
***And as a bonus, check out our latest video: Best Stocks To Buy Now For August 2021. Jason dives into a few names under pressure on his radar.