
Sizing Up Small Caps
Small caps rank among the biggest allocations in investors’ portfolios. Whether you hunt for outliers exclusively, or also use passive ETFs and active funds, sizing up small caps is an important call to get right!
Following the big money is a proven way to find long-term winners. Combining that with sharp, data-driven, top-down insights can only make you a better investor, especially in highly macro-driven markets like the one we face now.
The BMI has been nosediving at a fast clip lately amid mounting macro worries. Fans of MAPsignals know volatility often creates opportunity. Small caps have been hammered!
Today, we’ll help you separate signal from noise. Whether it’s the Omicron variant, inflation, Fed tapering, rate hikes, higher taxes, a potential peak in M&A or a strong dollar, we’ll leave no macro stone unturned!
And since we know many of you may pair passive strategies with your hunt for outliers, we’ll be sizing up small caps by comparing the two leading small cap ETFs. One tracks the Russell 2000 (IWM) and the other the S&P Small Cap 600 (IJR).
To me, one of these ETFs looks best for 2022 and beyond. The answer may surprise you!
Watch the Yield Curve!
Let’s start with yields.
It’s no secret Omicron, inflation, and a looming Fed policy mistake top investors’ worry list. The Wall Street consensus sees the Fed hiking rates twice in 2022 to get inflation under control. The CPI is forecast to remain above-trend at 3.7% next year.
Omicron and Fed tightening have economists expecting a mid-cycle slowdown to 3.5% GDP growth in 2022, down from this year’s 5.5% forecast. But many investors worry the slowdown could be much bigger if Omicron gets worse, inflation keeps rising, or both.
All this swirling macro uncertainty can seem overwhelming. It pays to keep things simple. Find macro indicators with track records of predicting investment performance and tune out the rest.
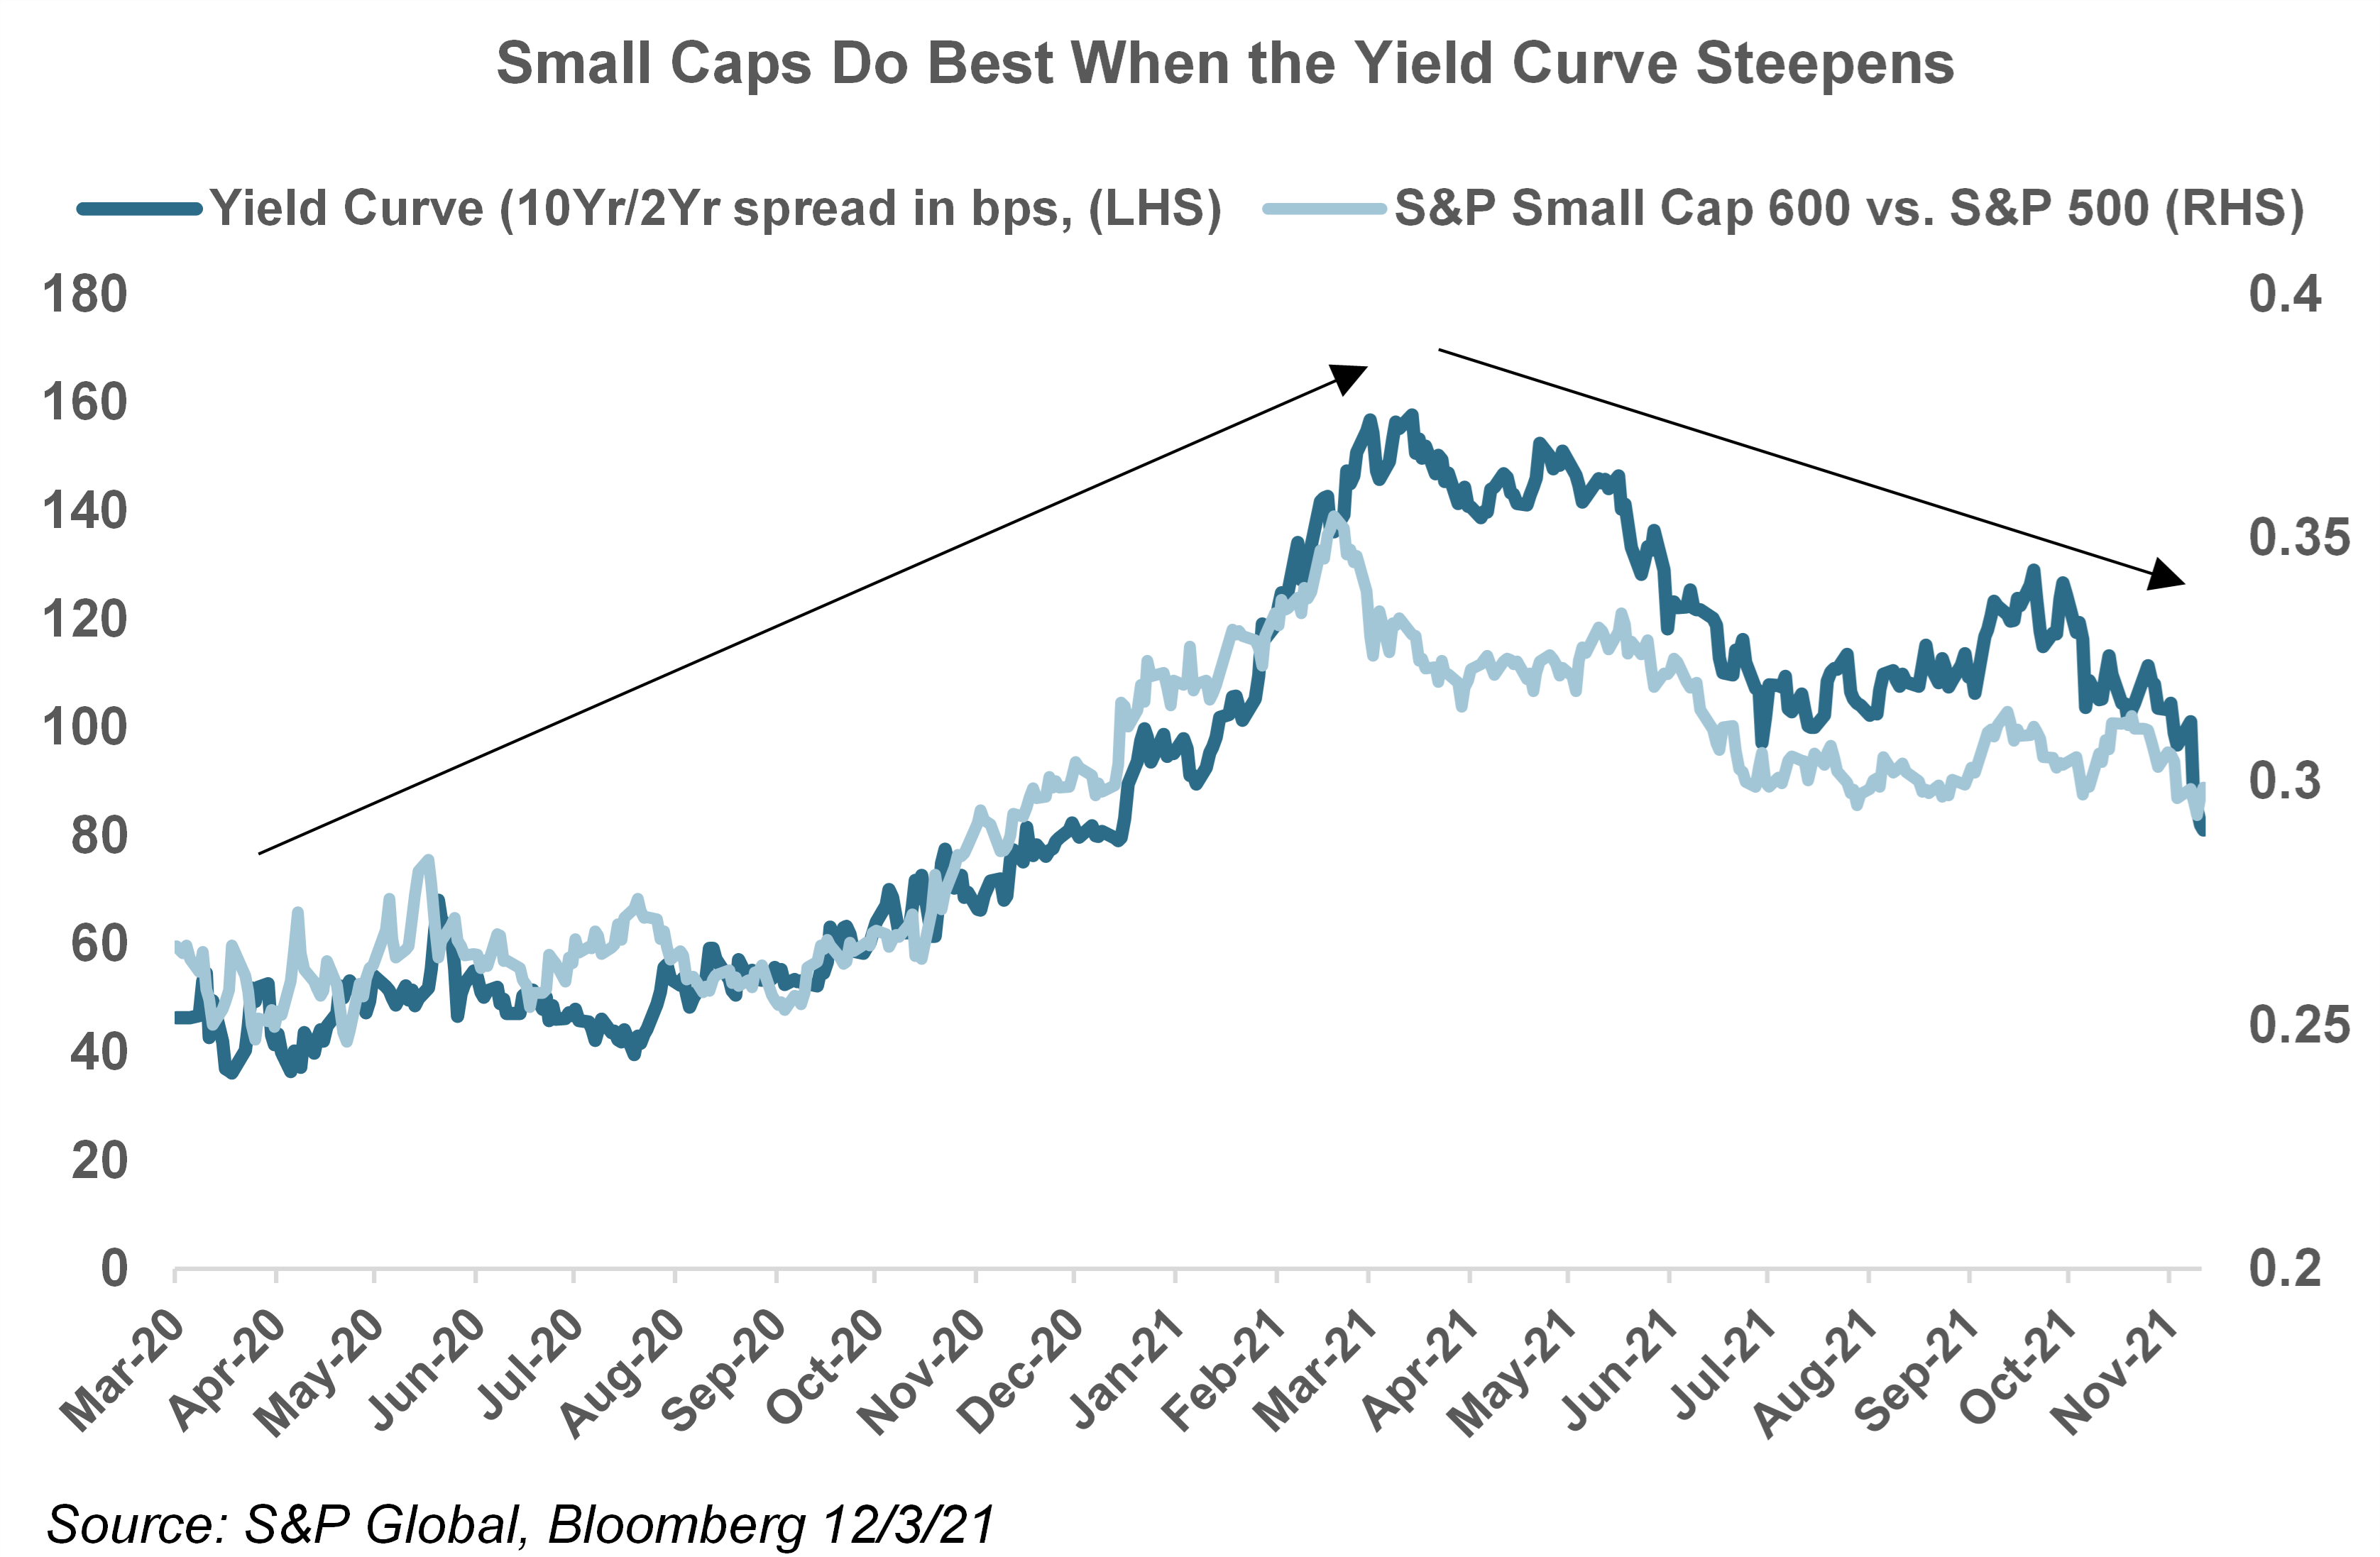
When it comes to sizing up small caps, the treasury yield curve is key. Small caps have a very strong historical track record of outperforming early in the cycle when the curve is steepening briskly. In other words, when growth is expected to accelerate.
We saw that from the March 2020 market lows through March 2021 (see chart).
But the curve has been flattening ever since as investors worry Fed tightening, and now Omicron, will combine to slow growth. Not surprisingly, large caps are outperforming since March. But so far, there’s little sign of an inverted yield curve (negative readings), which would signal recession and big declines for stocks across the board with small caps likely faring worst.
Forget Wall Street forecasts, the yield curve is the best small cap, macro indicator, bar none. Look:
Now you may be asking, “Why are small caps so tied to the yield curve and the economic cycle?”
That’s a great question. It’s due to their embedded value tilt. Value stocks are more cyclical, meaning they do best when the economy is growing. And as you can imagine, the faster the better.
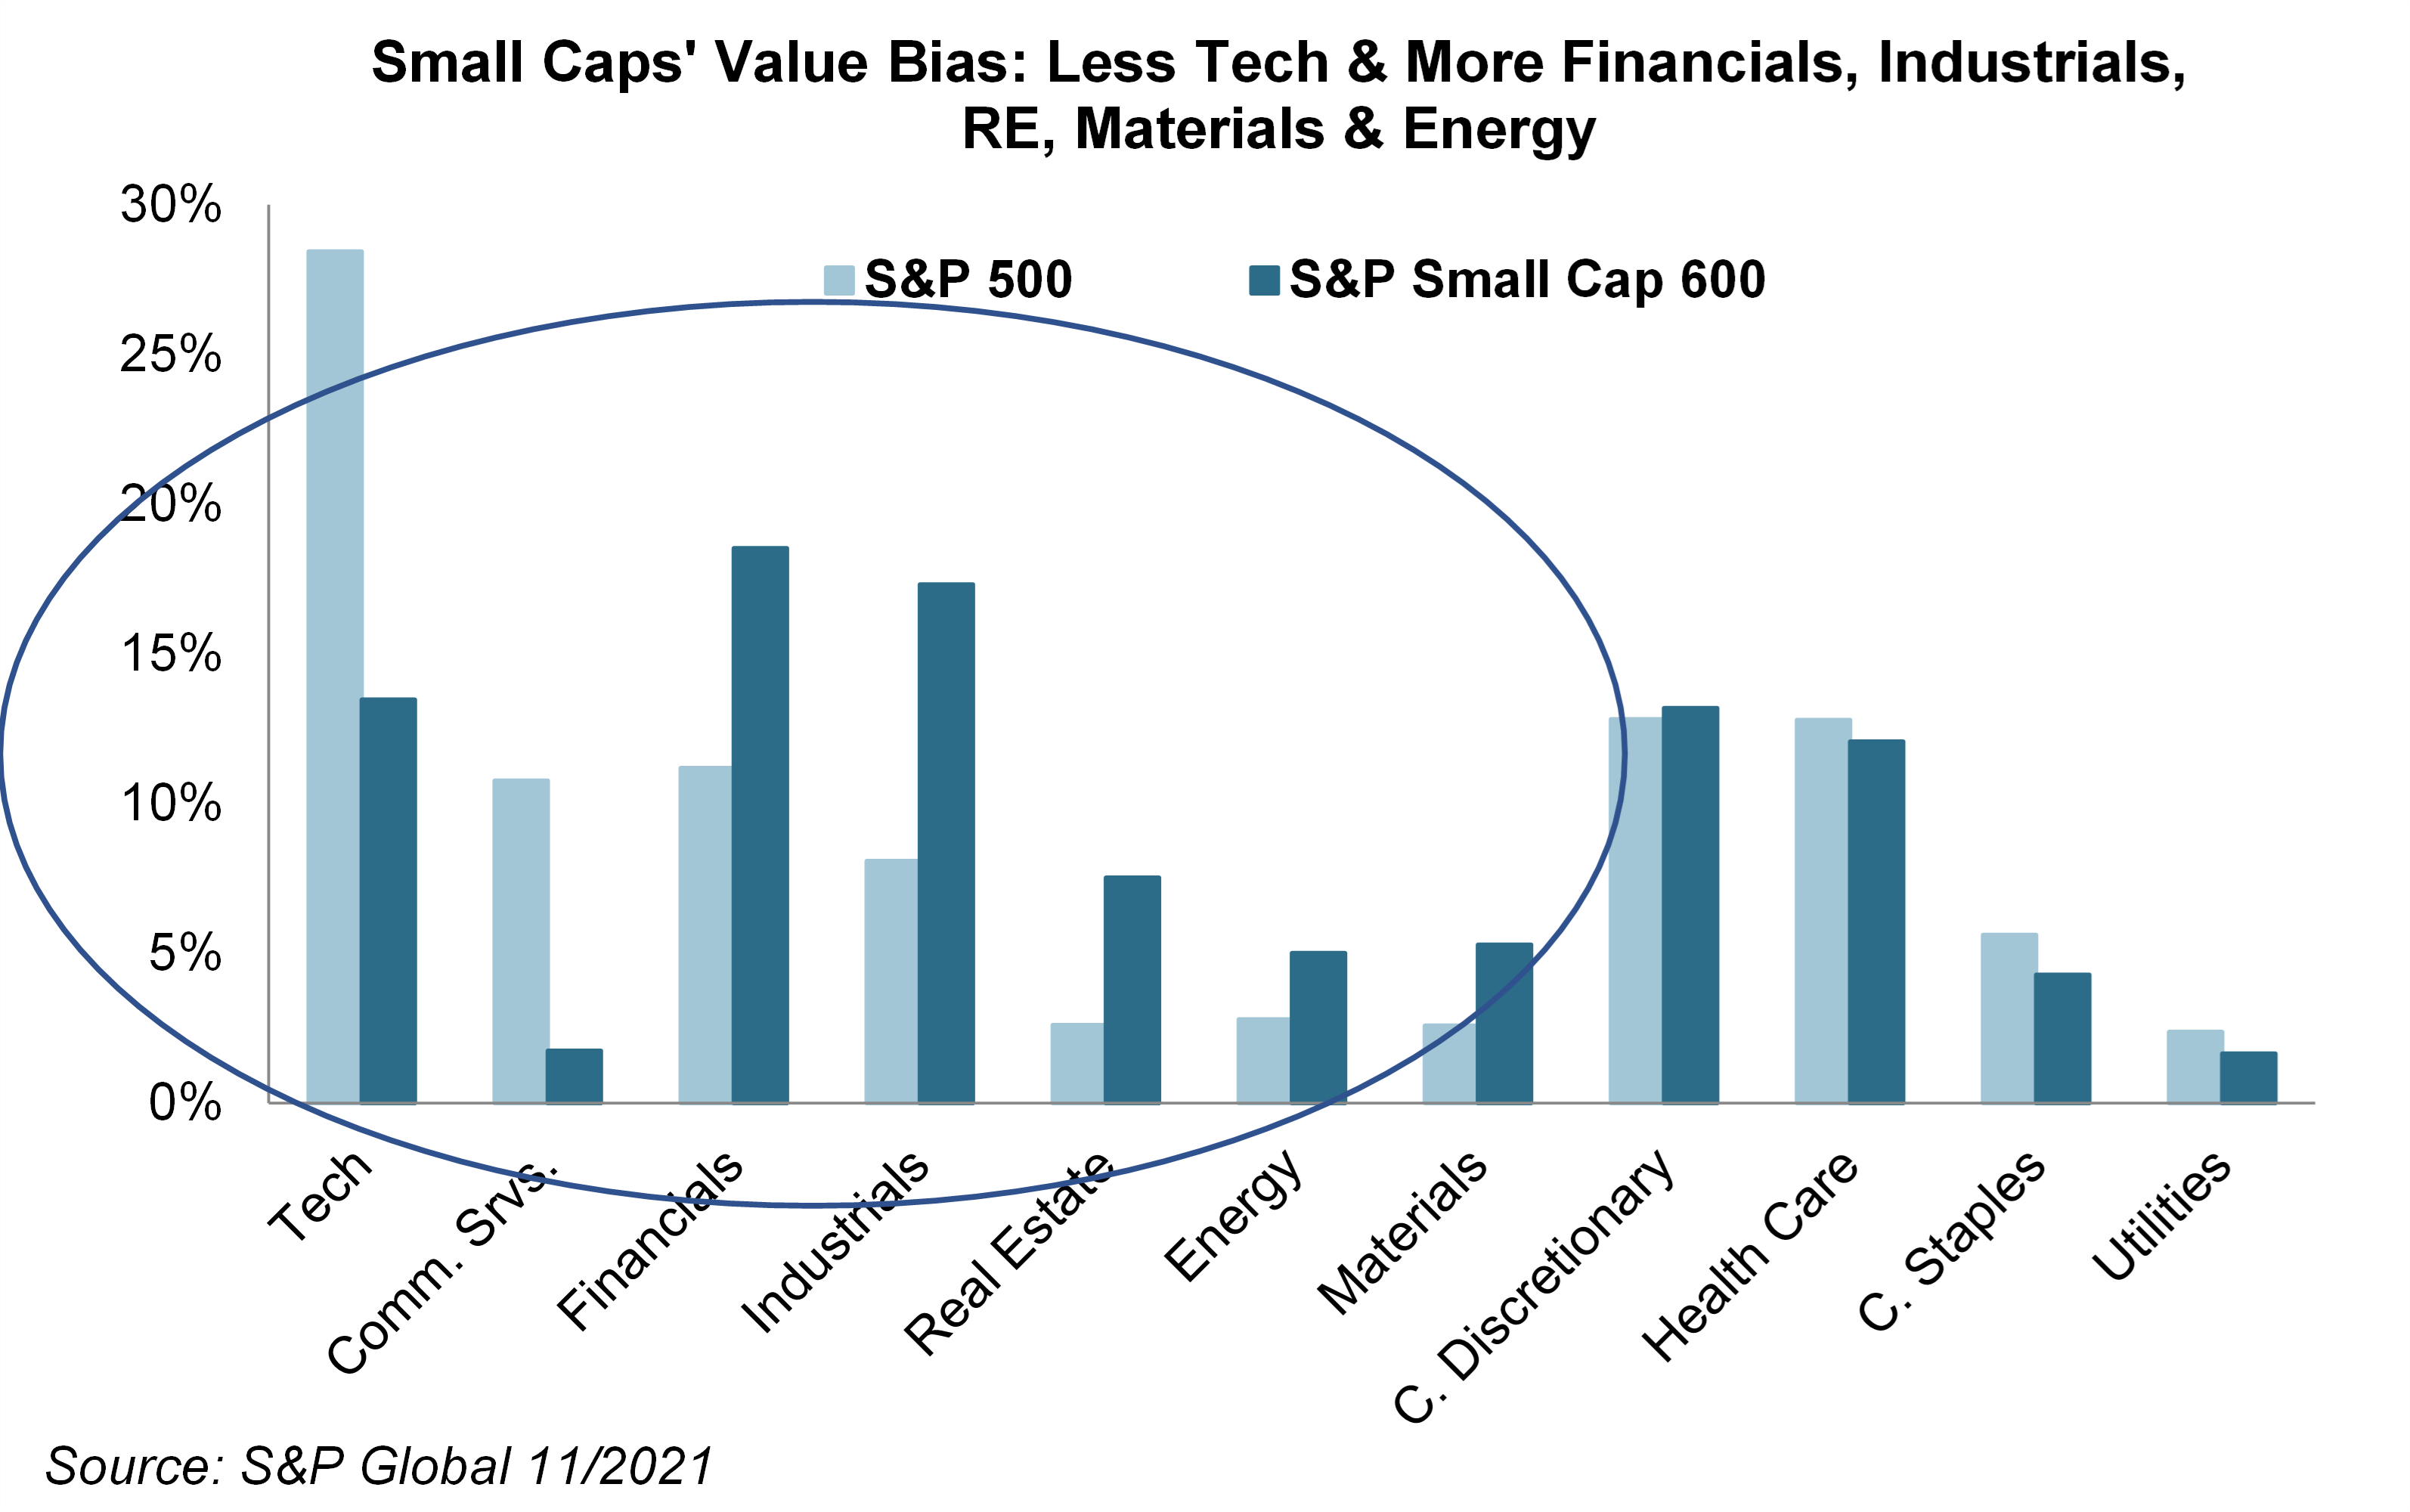
Small cap sector composition tells the story. More than 53% of the S&P Small Cap 600’s market cap is in cyclical, value-oriented sectors like financials, industrials, real estate, energy and materials vs. only 27% in the S&P 500 (see chart).
Digging deeper, the S&P 500 has a 52% allocation to tech, communications services, and consumer discretionary vs. only 28% in the SC 600. These growthier sectors are home to stocks whose pricey valuations are most vulnerable to rising interest rates that tend to accompany accelerating growth.
Check it out:
So, now let’s talk about inflation. Where’s it headed?
Mixed signals abound. While recent dollar strength and commodity weakness point to slowing price gains, the Omicron variant could keep workers sidelined and global supply chains snarled for months, boosting inflation. It’s a tough call.
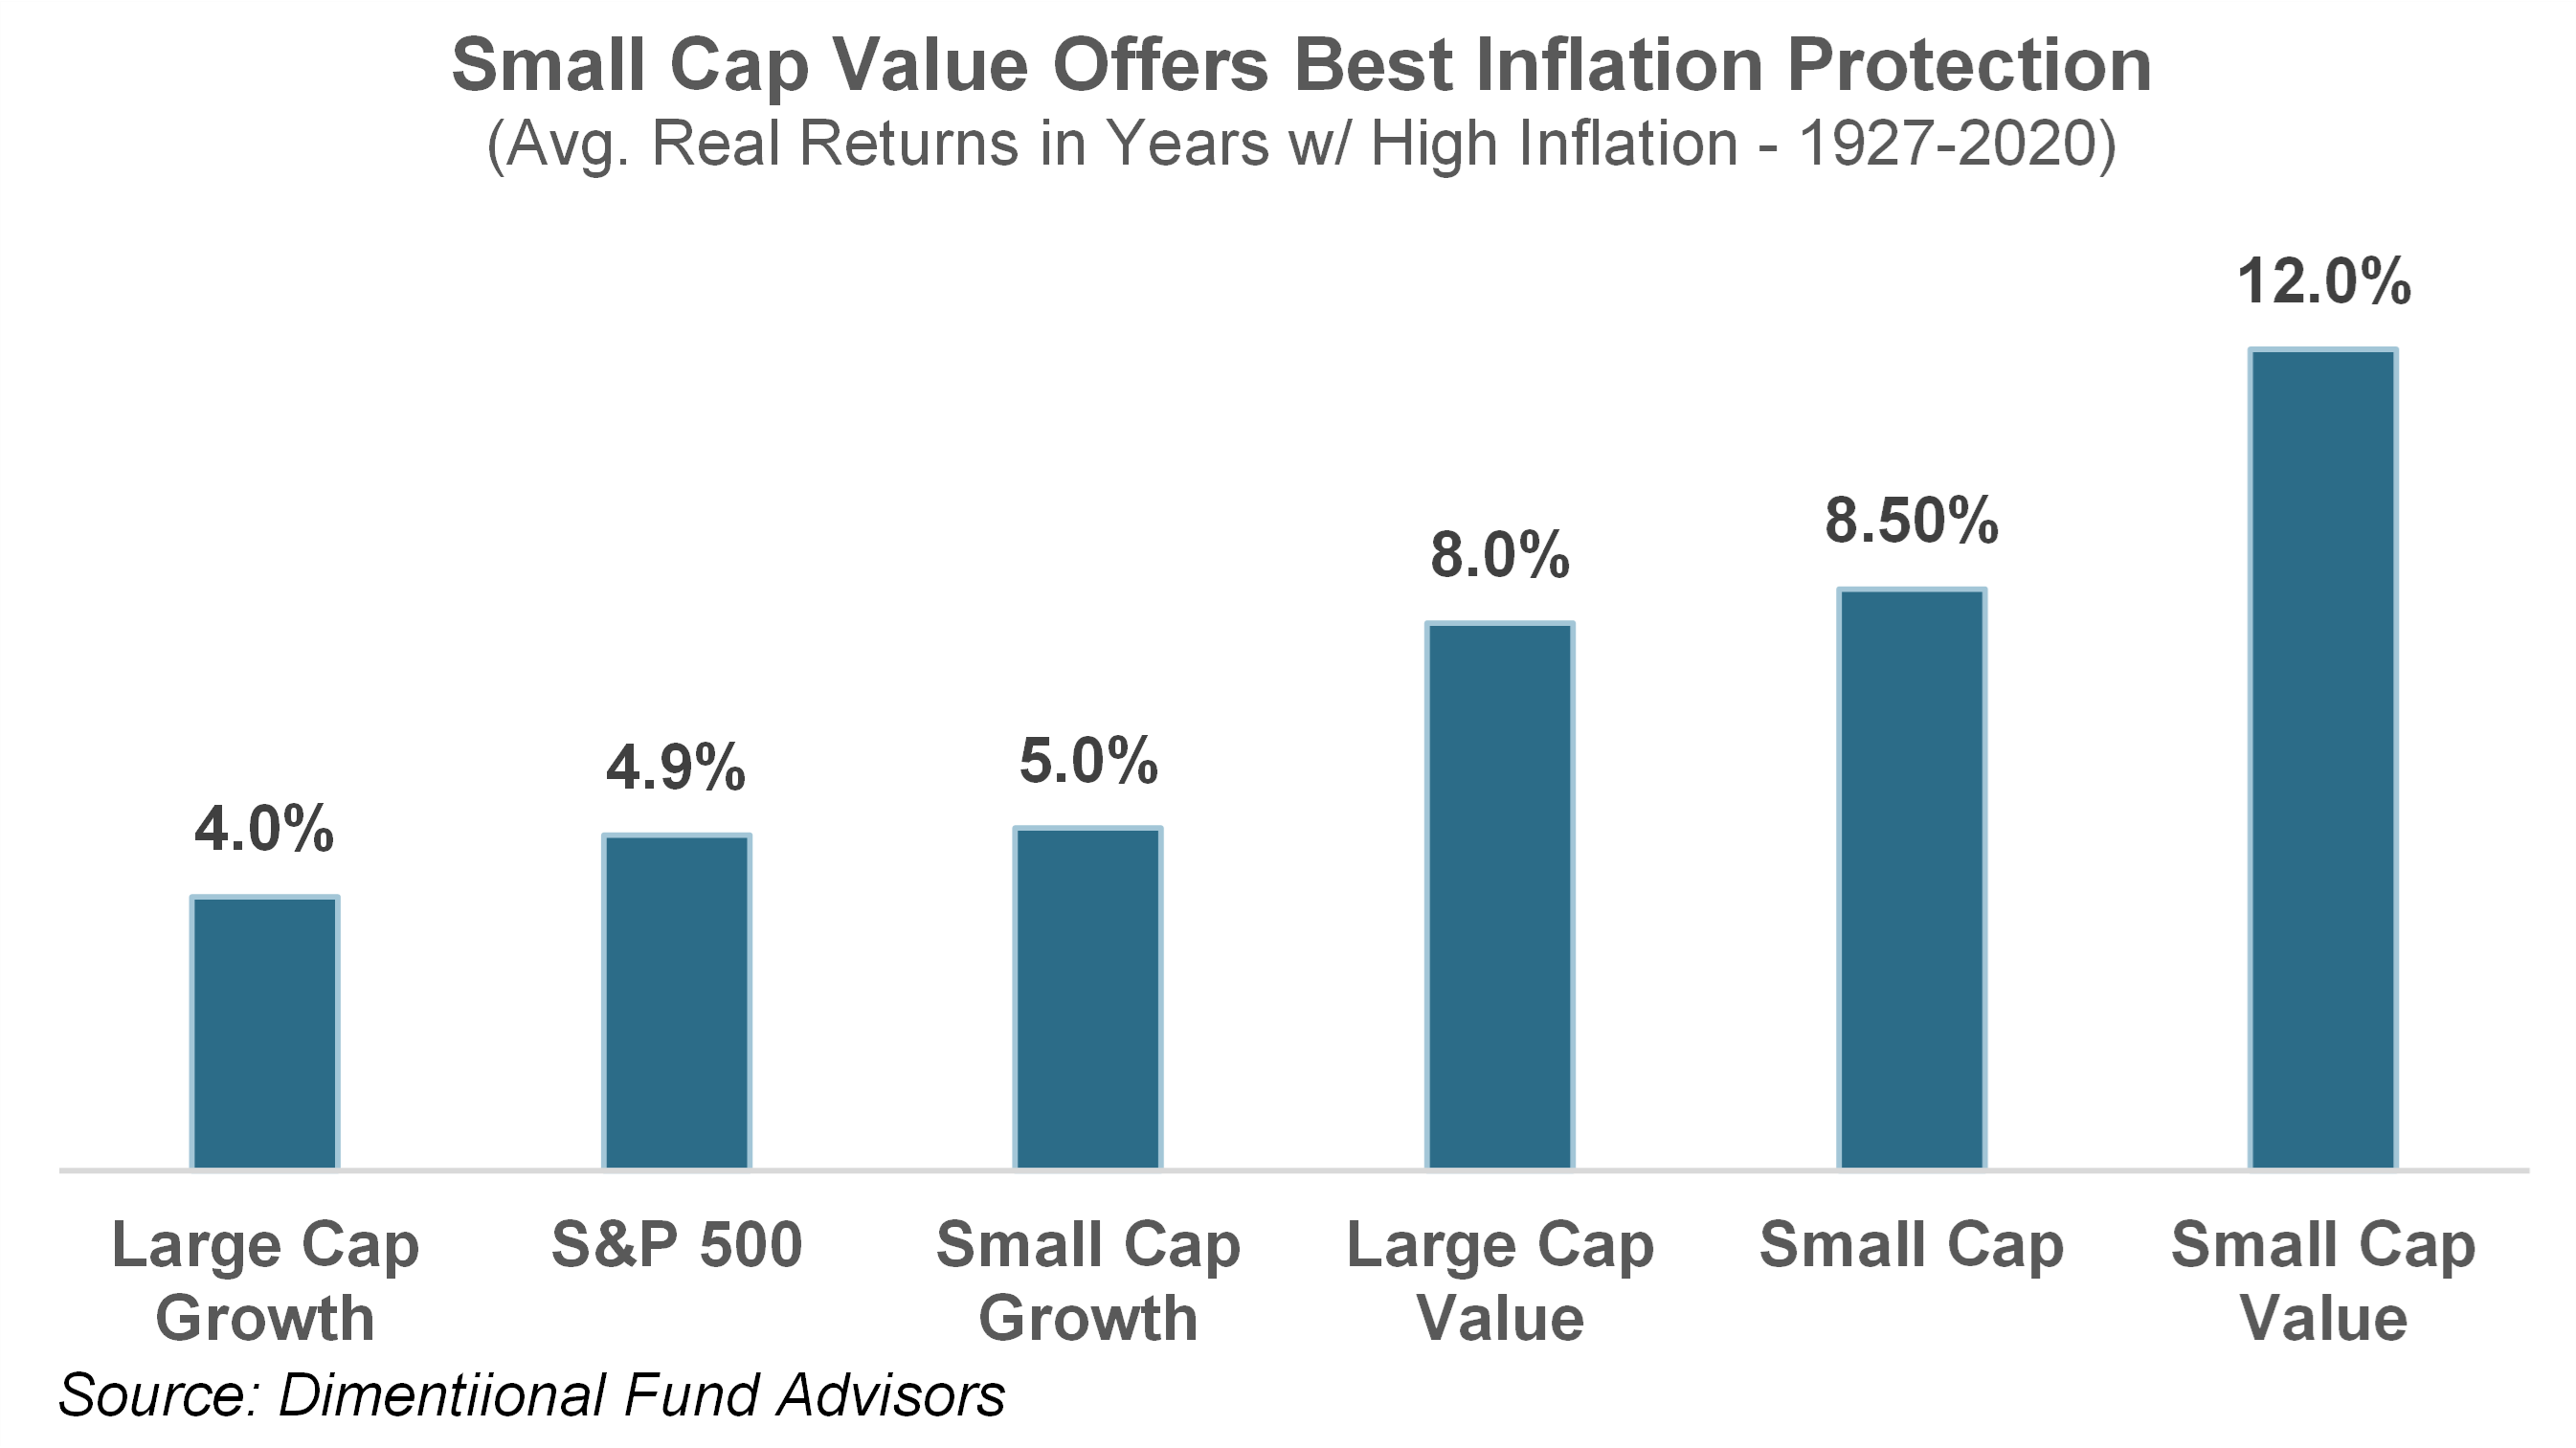
What we know for sure is that given small caps’ value tilt, they’ve historically beaten large caps when inflation’s been above trend (see chart). Small cap value has led the way with 12% real returns in years that inflation has been above average.
2021 has been a case in point. Even after its recent pullback, small cap value is still up 27% YTD through December 2nd. Look:
Sizing Up Small Caps, Macro Tailwinds
The wrangling in Washington over corporate tax changes is far from over, and final details remain elusive. But a proposal from Democrats seeks to stick in a 15% minimum tax on companies that report earnings of at least $1 billion in a year.
Based on results over the past year, that would affect just one company in the S&P Small Cap 600 vs. hundreds of S&P 500 constituents. In addition, any potential long-term capital gains tax hikes on the wealthy would disproportionately hit big tech winners like the FAANG stocks that dominate the large cap index.
So small caps look poised to weather any tax hikes better than large caps.
And let’s go further.
M&A activity has been strong this year as corporate balance sheets and acquisitive private-equity firms are flush with cash. Small caps are relatively digestible takeover targets and would benefit from the continuation of this trend—either by being acquired themselves or by seeing their valuations rise when competitors are bought out.
The US dollar has risen 7% YTD, with most of the gains coming in the past few months. A better relative COVID response, higher US rates and the prospect of 2022 Fed tightening have all boosted the greenback.
After all, the US is the best performing major economy in the world. Dollar strength generally hits large caps more than small caps because S&P 500 companies derive 35% of their sales overseas vs. only 22% for small caps.
A firming buck makes multinationals’ products more expensive internationally. In addition, when mega-caps repatriate their foreign sales, they convert into fewer dollars.
Picking the Best Benchmark: Russell 2000 vs. S&P Small Cap 600
The two leading small cap exchange-traded funds are the iShares Core S&P Small-Cap ETF (ticker: IJR), a $70 billion ETF with an expense ratio of just 0.06%, and the iShares Russell 2000 ETF (IWM), which charges a higher 0.19%. Despite getting vastly more media attention, IWM has lost market share and is now a tad smaller than IJR at $69B.
Unlike the Russell 2000, the S&P 600 index requires companies to have four consecutive quarters whose sum of earnings is positive. It therefore includes a narrower, higher-quality slice of the small-cap universe.
This makes it a better choice if growth slows and/or rates keep climbing.
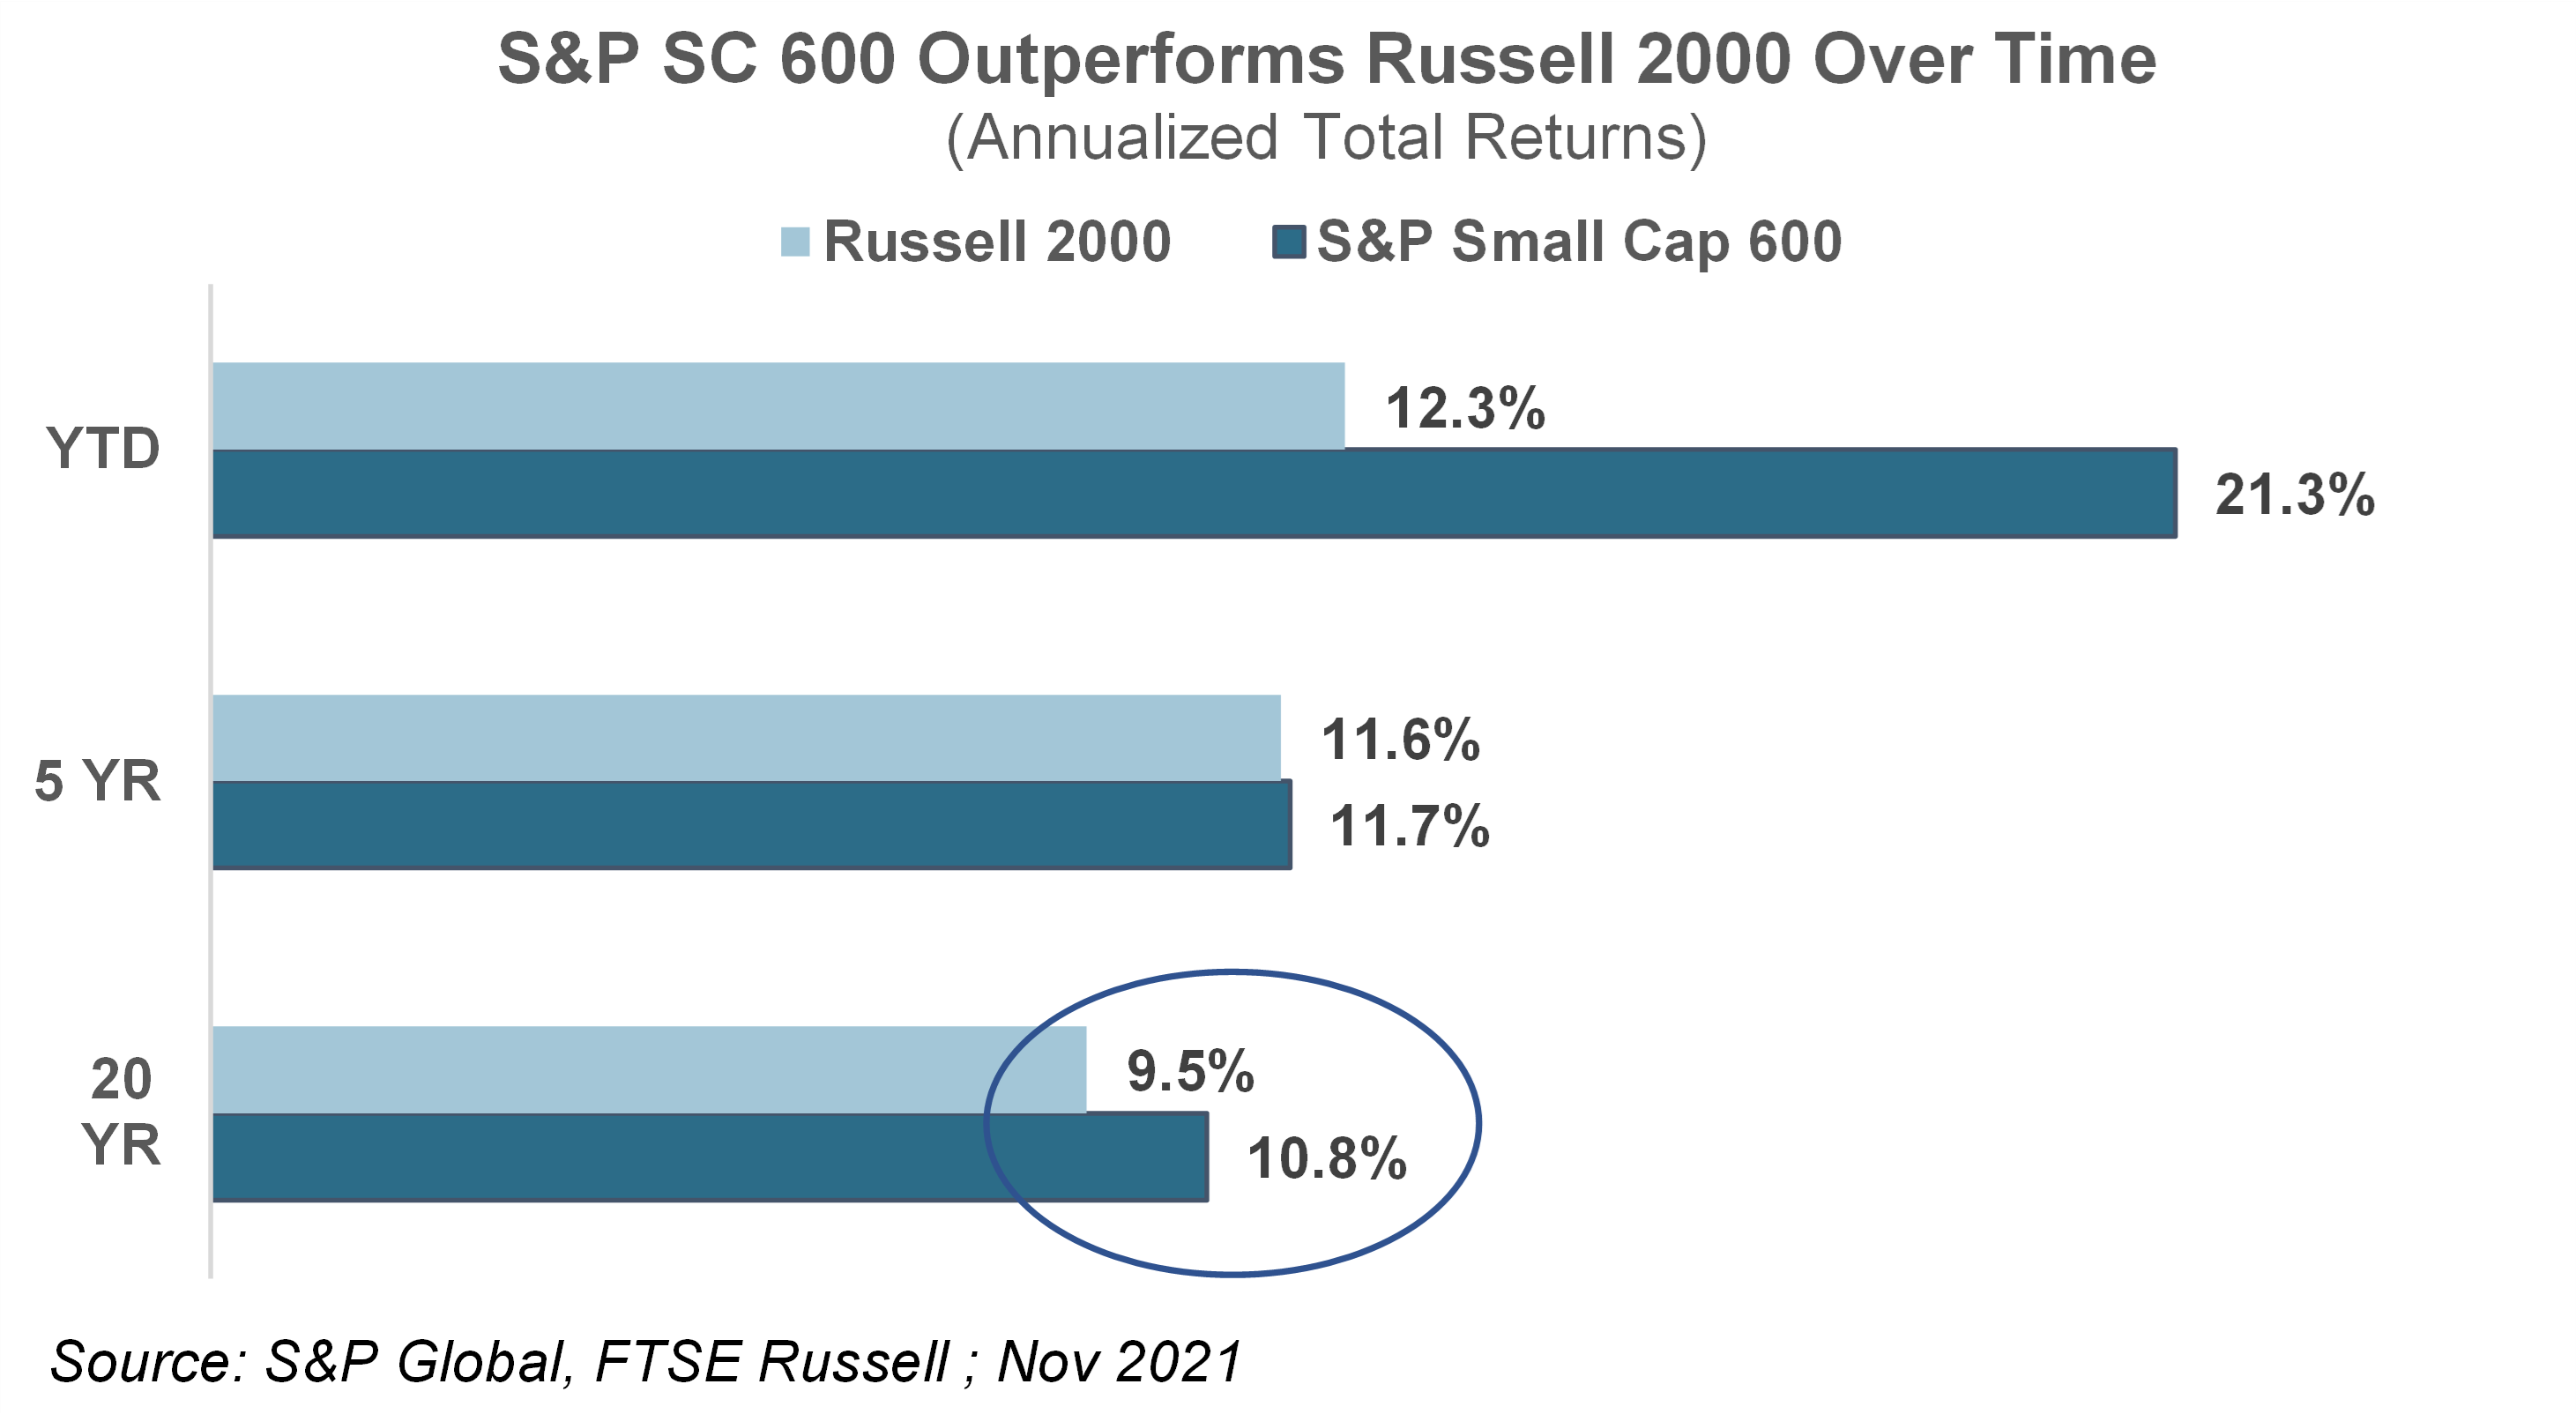
Many profit-challenged companies rely heavily on debt to stay afloat, leaving them vulnerable as the economy cools or the cost of capital rises. Given 2021’s inflation spike and growing Omicron worries, it’s no surprise the higher quality S&P SC 600 has trounced the Russell 2000 this year.
More importantly, the S&P Small Cap 600 has beaten the Russell 2000 by an annualized 1.3% over the past 20 years (see chart). It turns out, quality matters.
Don’t get me wrong, the Russell’s broader composition helps it outperform coming out of recessions, early in the economic cycle.
2020 was a case in point. But lagging most of the time has made it hard for the Russell to match the S&P SC’s stellar long-term track record.
Check it out:
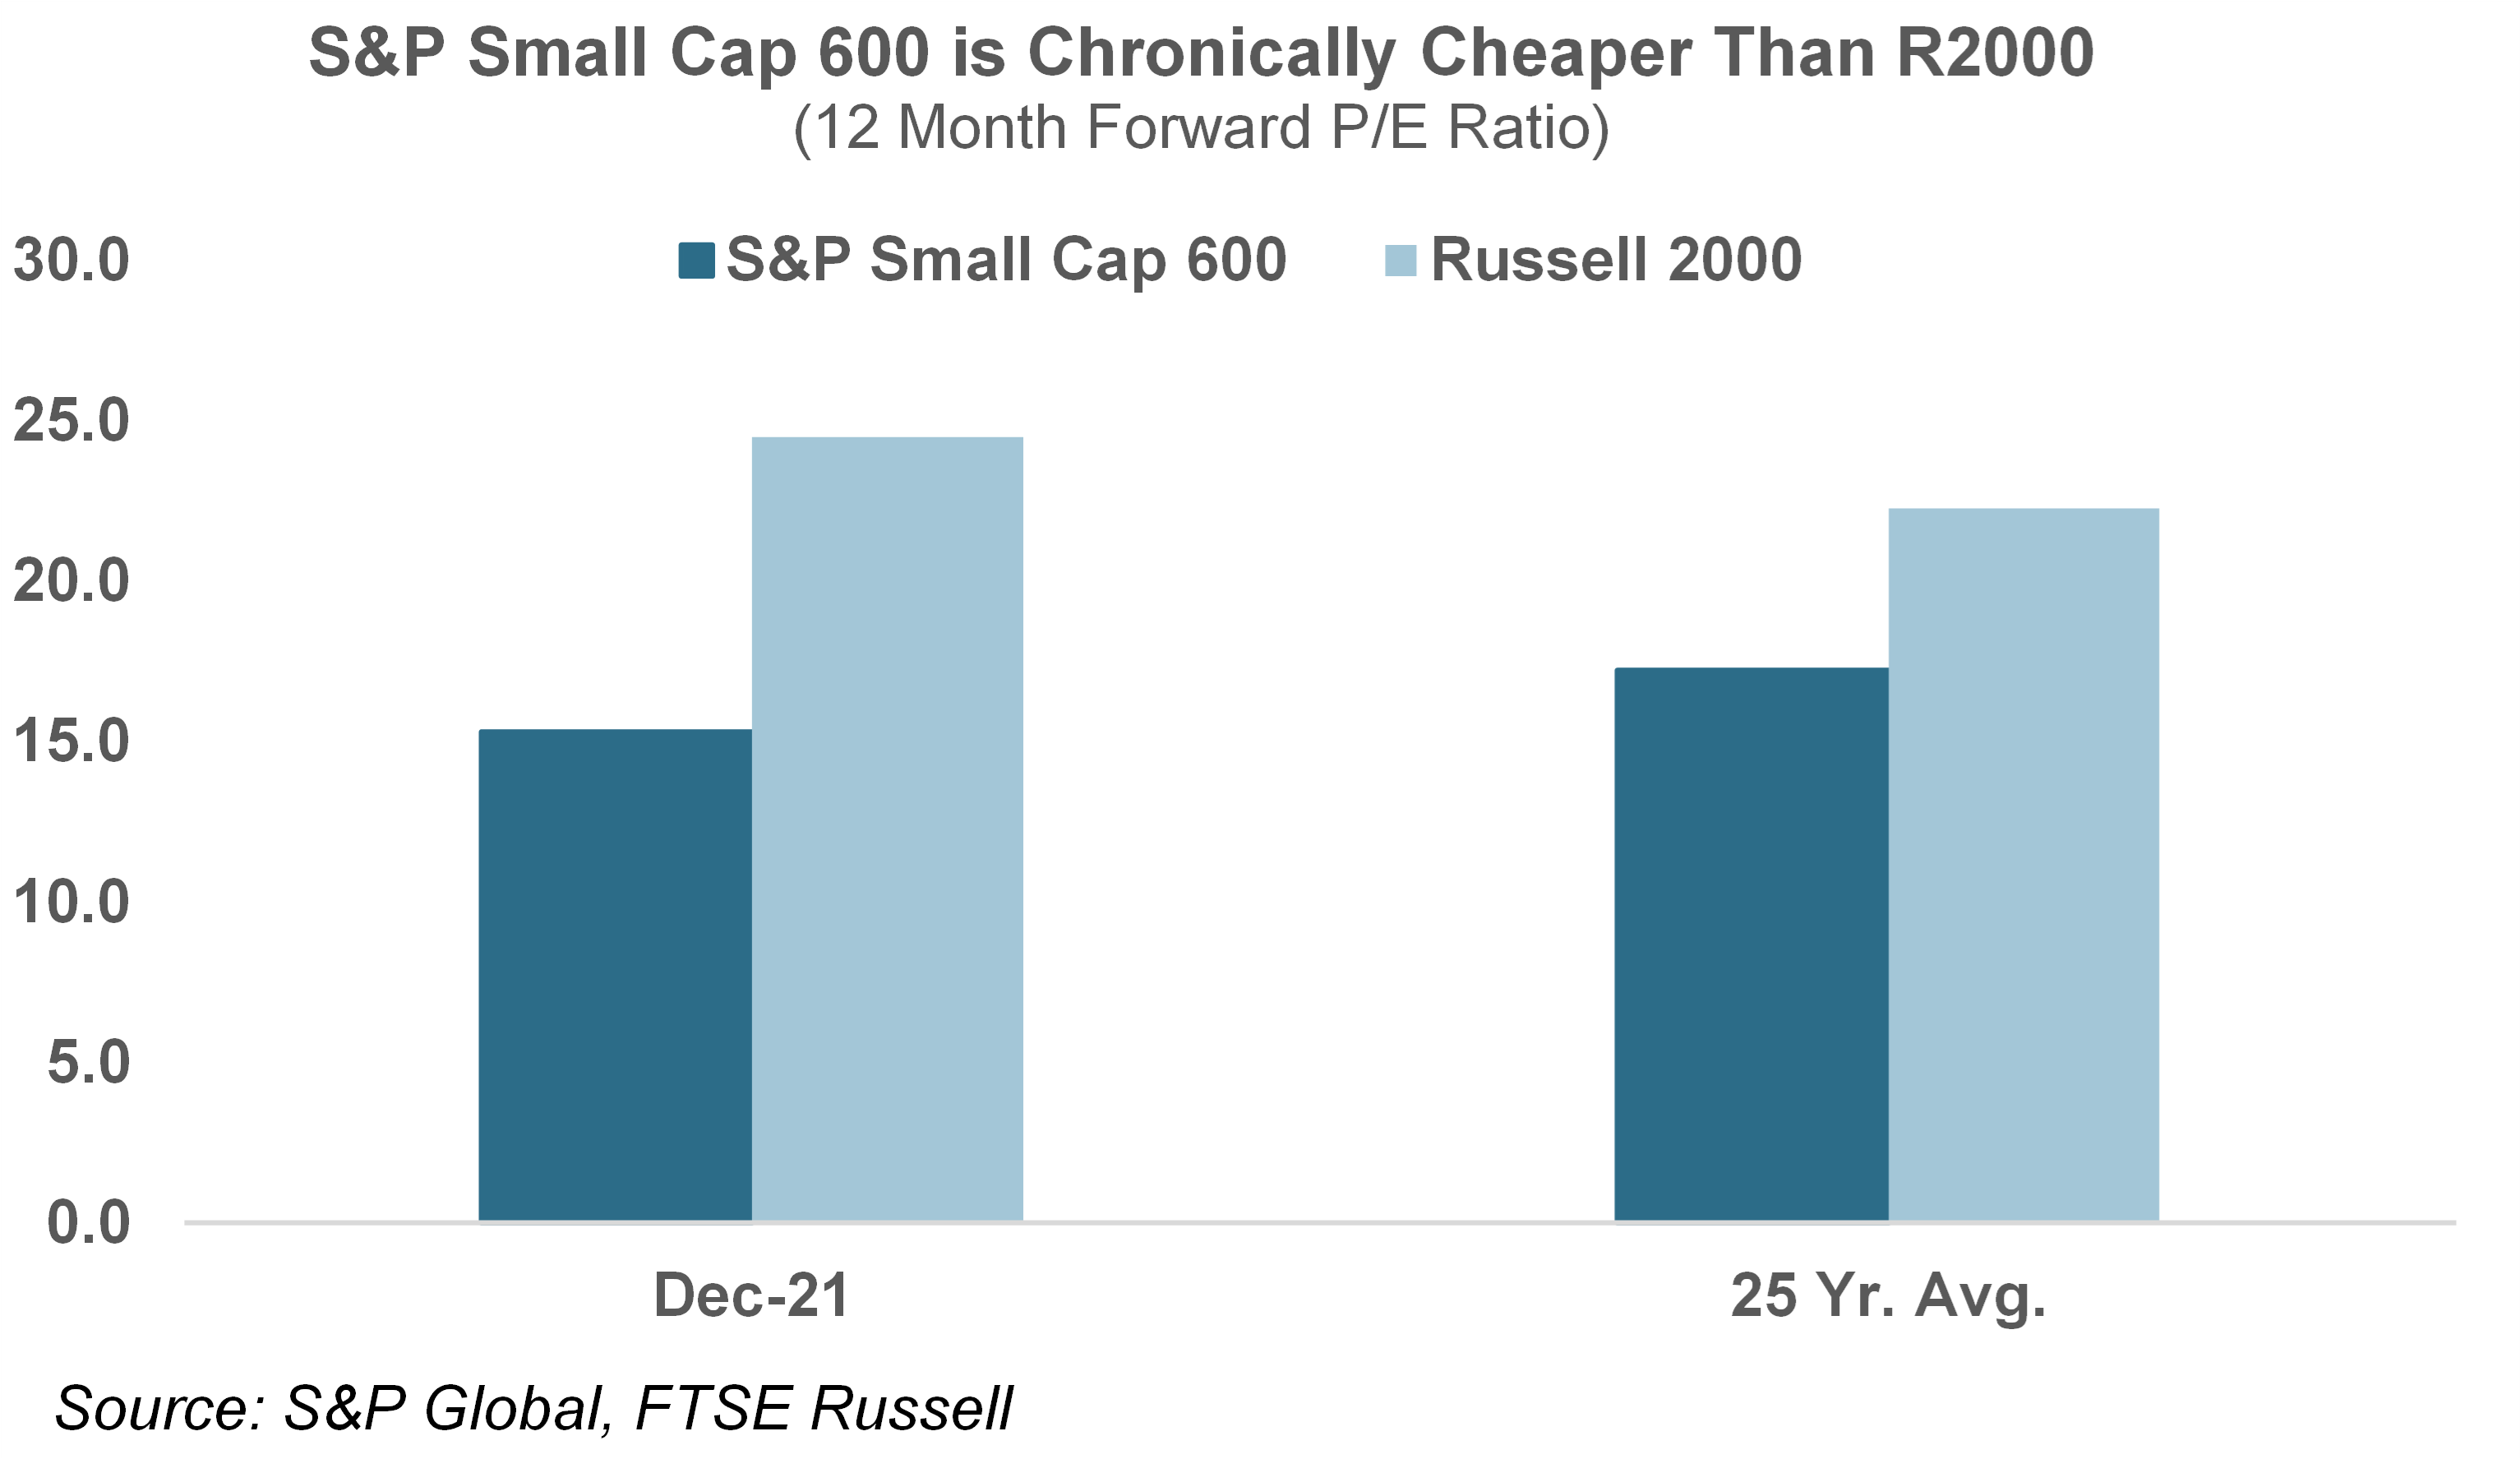
To top it all off, the S&P SC index trades at only a 15.3x 12-month forward PE vs. 24.5x for the Russell 2000. This valuation gap isn’t unusual. Over the past 25 years, the Russell has averaged a 22.3x forward PE vs. only 17x for the S&P SC 600 (see chart).
Why? 30% of Russell 2000 constituents are unprofitable, chronically inflating the index’s valuation.
Let’s bring it all together.
We’ve covered a lot of ground sizing up small caps.
Here’s the bottom line: The Treasury yield curve is flattening as investors worry stubborn inflation may lead the Fed to overtighten monetary policy, cooling growth and risking recession.
Omicron is only fanning those growth fears.
Rather than trying to parse all the economic noise, just watch the yield curve. Positive readings indicate continued economic expansion and decent small cap performance. But don’t expect small caps to rip and outperform the S&P 500 until you see the yield curve start steepening again.
In other words, small-caps will take the lead when growth is expected to accelerate.
Small caps are cheap. The S&P SC 600 trades at just 15.2X times forward EPS vs. 20X for the S&P 500. Small caps have historically commanded a premium.
Small cap value offers a cheap oversold inflation hedge.
Within your small cap allocation, overweight small cap value (ETF: IJS) for two reasons: its stellar track record weathering inflation and its attractive relative valuation after the Omicron sell-off. It’s trading at only 13.2X forward EPS vs. its 10-year average of 15.7X. By contrast, small cap growth trades at 18.5X, in line with its 10-year average.
Importantly, when it comes to implementing passive small cap strategies, use S&P Small Cap 600 based ETFs. It’s a higher quality index with a proven track record of beating the Russell 2000 over time thanks to better performance in all but the earliest phases of the economic cycle.
Happy Hunting!
-Alec