
Stock Market Data Is Beautiful
Recently a guy told me something I’ll never forget. He said, “MAPsignals is the best research no one knows about.”
I agree. And once they do find us, a few will realize that stock market data is beautiful.
This past week I traveled. I needed a break from the hustle and bustle. Importantly, I got a chance to sit with one of our subscribers.
He runs a successful RIA (Registered Investment Advisor) practice. We talked shop and covered the markets. Eventually we got into why he likes what we do. And to paraphrase, he let me know that our information is unique and tells a different story than other research out there.
And that’s important. Because from where he sits, he needs to not only manage people’s assets…but he also needs to inform them.
And that’s when stock market data is beautiful.
Helping investors follow the Big Money is great and all, but knowing how to make informed decisions around data is critical.
It was a great chat to say the least…more on that in a bit.
In today’s post I will shed light on where we were last week: Big Money Index Is Nosediving…and then get you up to speed on recent action.
The twists and turns don’t stop in 2021. Thankfully, that’s opportunity. Yeah, stock market data is beautiful.
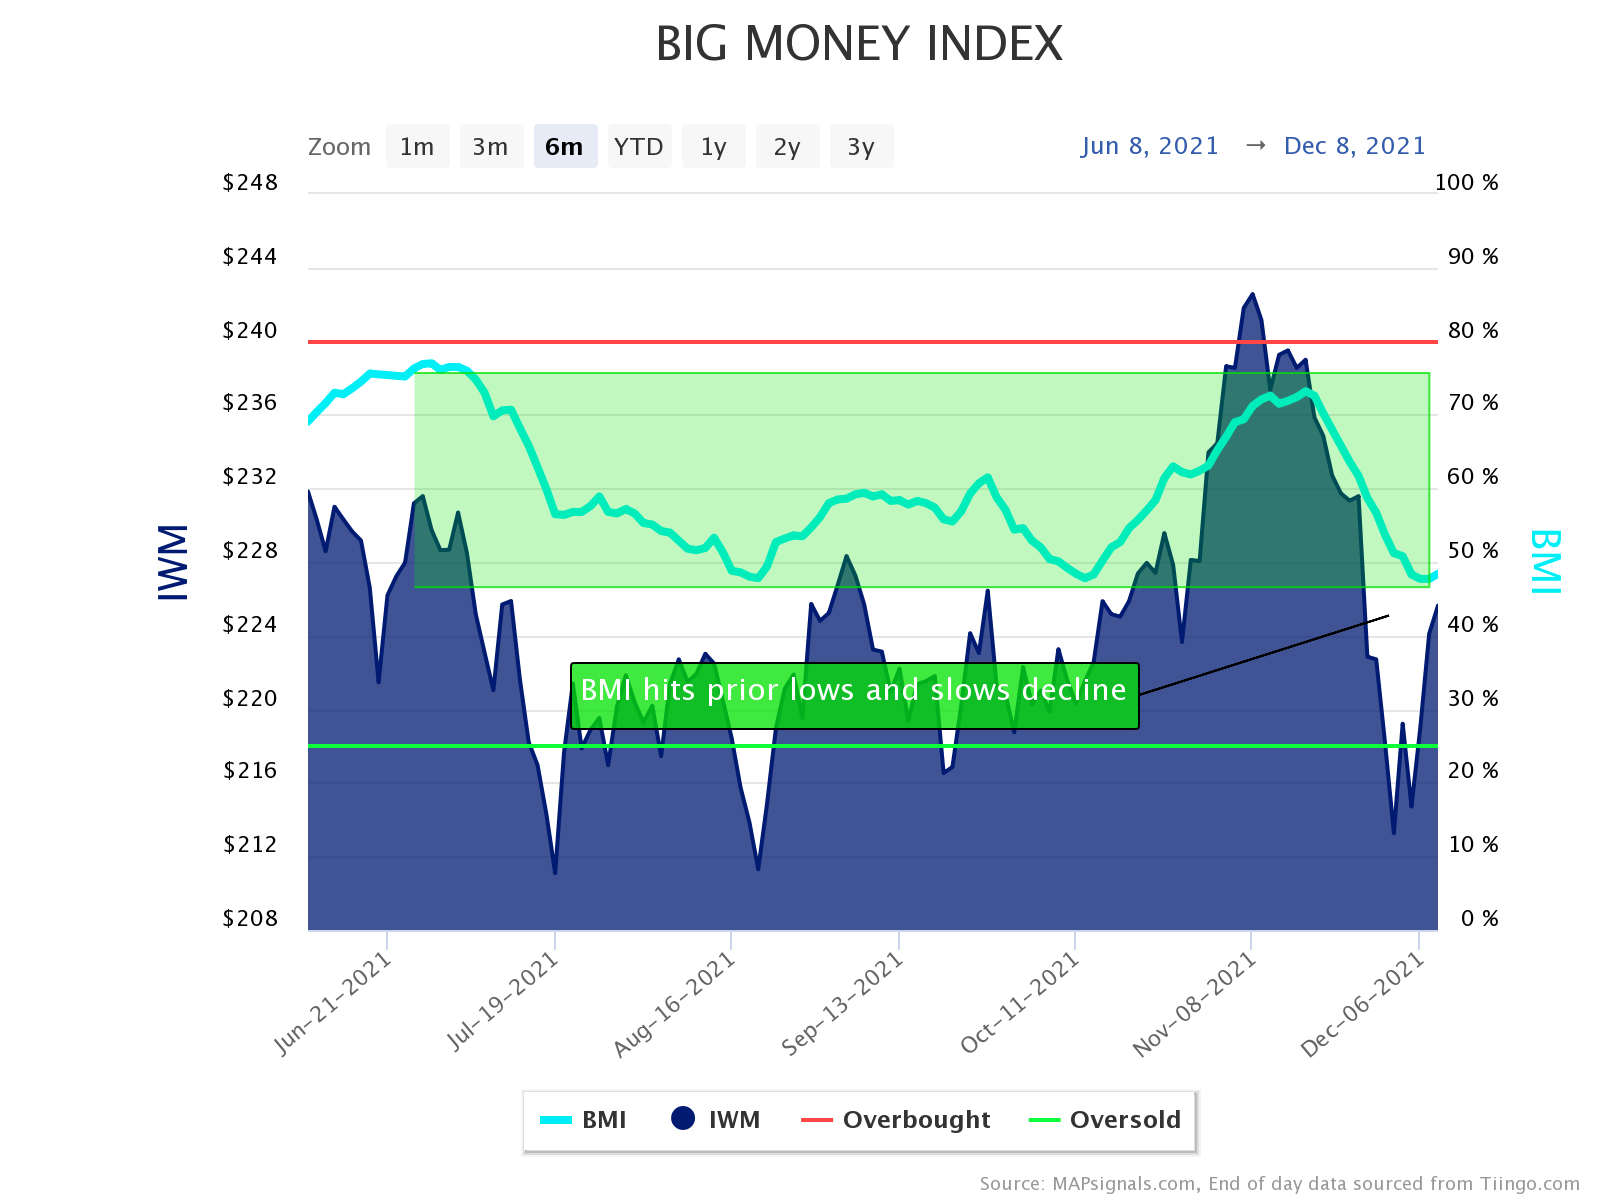
Big Money Index Slows Decline
I’m not a technical guy, but look how the Big Money Index hit prior resistance and then the market bounced.
Literally, the BMI has hit a floor around the 48% area. You can see it clearly in the 6-month chart below:
And it’s easy to see this in retrospect. But, under the surface the data was shifting as we hit local lows. Let me show you what I mean.
(Subscribers can see all of these charts in our portal.)
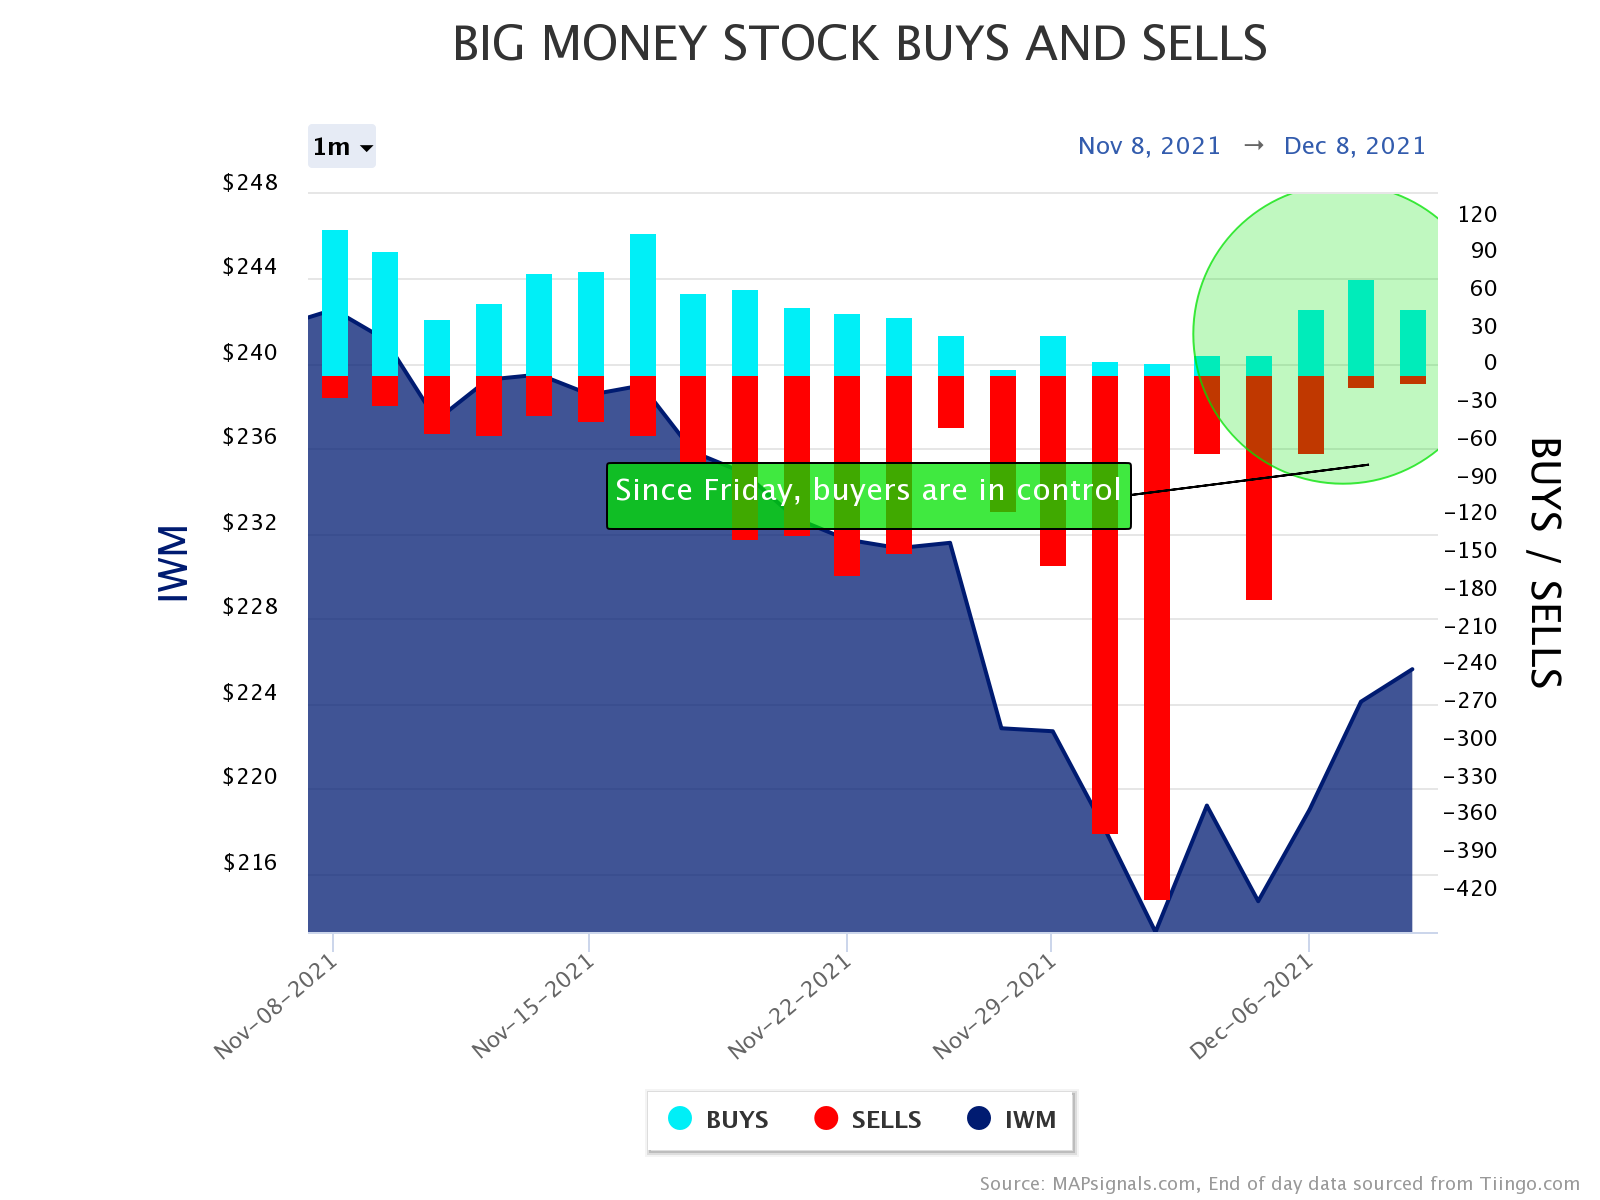
I always showcase the Big Money Stock Buys and Sells chart. These are the daily signals that make up the Big Money Index. But I’m going to clue you in on how I spot bullish action in a sea of red.
Last week we were coming off the biggest single day of selling since the pandemic. I’ve notated that below. But, also notice the blue circle…that’s Friday’s action.
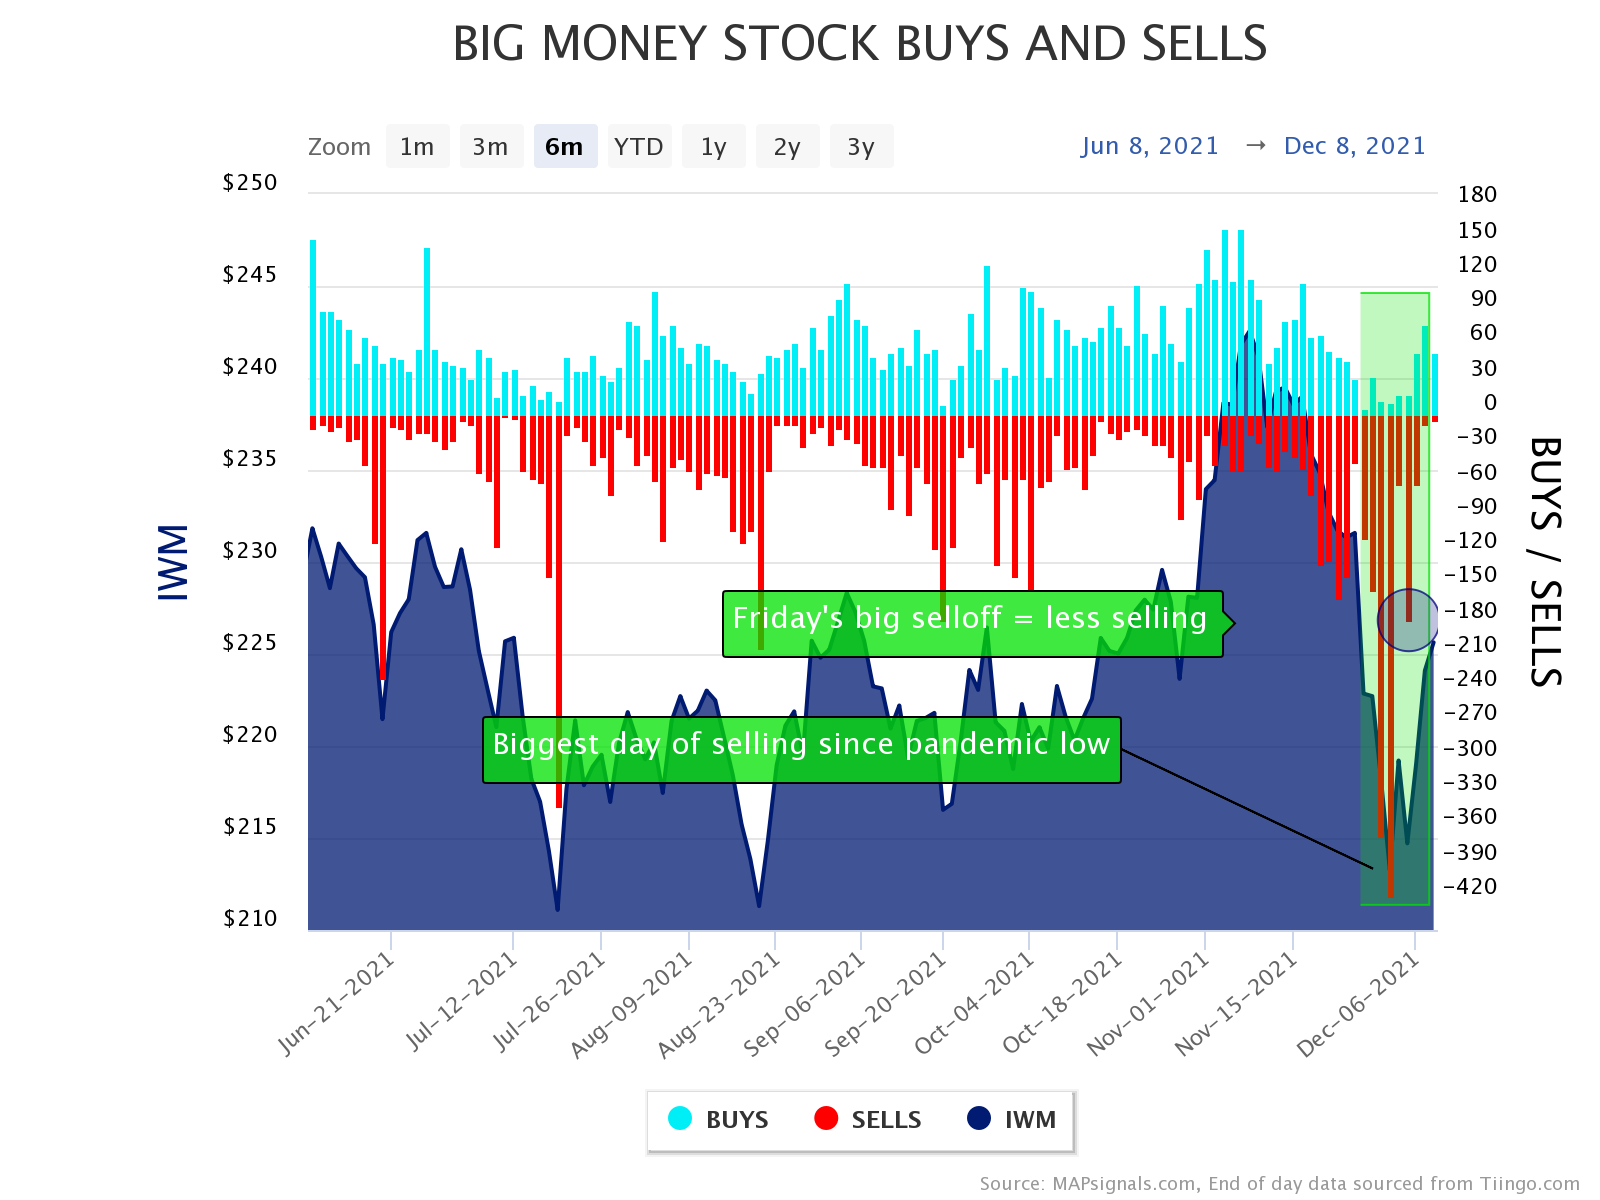
My meeting last week was on Friday. If you recall, markets were coming unglued. We were watching the carnage in real-time. It was a big volume day with indexes in the red.
But when I looked the following morning, something stuck out to me as peculiar. The level of selling on a big down day slowed dramatically. Below you can see what I mean.
Look how Friday’s (12/3/2021) Russell 2000 return looks similar to prior down days. More importantly, notice how selling slowed immensely.
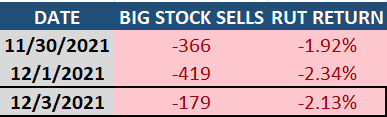
That, folks, is a signal to pay attention to. Stock market data is beautiful! I remember talking this over with Jason (MAPsignals cofounder). It was clear to us that there was less pain going on in markets.
Yeah, that’s bullish near-term. Stocks have rallied in an epic fashion since then. Buyers have taken control and sellers have evaporated. Let’s zoom-in on the action since Friday:
This is the exact reason the BMI slowed its decline. Let’s all say it loud, stock market data is beautiful!
The trend right now is this: selling is slowing and buying is growing. Now, let me wrap up with my meeting recap.
Stock Market Data Is Beautiful
Being far away from Wall Street has its benefits. The constant back and forth of stock movements feels amplified when you’re glued to a computer screen.
I’ve found that to be counterproductive. Following the news never worked for me. Following data gave me a lot more confidence when it came to investing.
In our meeting, I popped open the laptop and showed how epic the selling has been recently. Then I pointed to prior similar instances, and how historically it can be a great time to pick up great stocks on sale. Find more in a prior post, how to buy the dip.
That positive message was contagious. We ended up trawling through stocks we liked and didn’t like. We started naming prices we liked, too.
Eventually we kept coming back to today’s message…and it was said many times in our meeting: Stock market data is beautiful.
As I wrap up, just know this. There may have been some buying of great stocks happening in that room… data can shed more light on the future than focusing on fear and headlines.
One thing is for sure. When you focus on outlier stocks, pullbacks are opportunities. These are companies growing their revenues and earnings year after year.
They can be found in our Top 20 and Top 50 lists. This data-driven approach has found countless all-star stocks. And my bet is it’ll keep doing it.
Let’s finish up.
Here’s the bottom line: After seeing the biggest selling since the pandemic lows, the BMI has slowed its decline. Selling slowed dramatically as buyers increased.
The risk of going oversold in a couple of weeks has dropped big time with this new data.
Dipping toes when there’s market pain tends to reward the bold.
No matter what you do, try and utilize data in your investing approach. It’s helped me immensely. I bet it will for you, too.
MAPsignals may actually be the best research no one knows about. But when they do find out about us…those five words appear again.
Stock market data is beautiful.
***Finally, check out our latest video: How Big Institutions Trade Options. Jason and I think back on our trading days and what we learned. And the music is made by Jason himself…that’s a bonus!
Make sure to follow our YouTube channel here so you never miss any of our videos.