
Stocks Are Going Down
When stocks were quiet on the trading desk, we’d get antsy back in the day. Traders crave action.
Markets that hum along day after day, can get frustrating. Then, suddenly from nowhere sentiment would change, catching most off guard. Then we’d say to ourselves, “stocks are going down.”

Maybe it was some anxious news headline that hit the tape at a weak moment for the market. Or it could’ve been a scary rumor. Whatever the story du-jour, we could intuitively tell when something was amiss. Clues would start to jump out on our screens.
Volatility would start to increase. Volumes would jump. Stories of some hedge fund “caught wrong way” would usually swirl around the chatter mill. Clients would ask if we heard any rumors.
The environment often changed rapidly. Inevitably fear would spike. It was almost like everyone simultaneously decided that stocks are going down. And that meant we’d have to adapt our trading.
As market-makers, in normal markets, we’d make tight markets. That means, when someone calls and wants to sell 500,000 shares of XYZ ETF, we might be only 2 cents below the current bid price for the full size. But, in fast market conditions, those bids would be way lower.
We might be down 6 cents “immediate”- meaning, trade now or the bid is cancelled. Give it another 10 seconds, we might be down a dime. This liquidity shift wasn’t just us: It would spread all over Wall Street. Professionals had to be on guard because our job as traders was to protect the firm’s capital.
I’m reliving this story because today’s headlines are more terrible than usual. We see: Chinese stocks are in shambles, the COVID Delta variant is spiking cases, taper talk, and let’s not forget there’s trouble in Afghanistan.
It’s a perfect storm for stocks in the thin seasonally liquidity of summer. And while it may seem like pain for stocks has come suddenly, we’ve been detailing troubling signs for well over a month.
In early July, we started banging the drum about getting ready for summer volatility. Nowadays, we don’t look at screens anymore and definitely don’t surf headlines for market clues.
We focus on data.
We experienced firsthand how Big Money accounts can change direction on a dime. And we built a process that looks for that action. For months, from November to February, buying was non-stop. Now, that’s no longer the case.
We like data because it paints a very clear picture: Selling has been accelerating. But that’s just part of the Big Money cycle; like phases of the moon. Here’s a diagram of the Big Money phases:
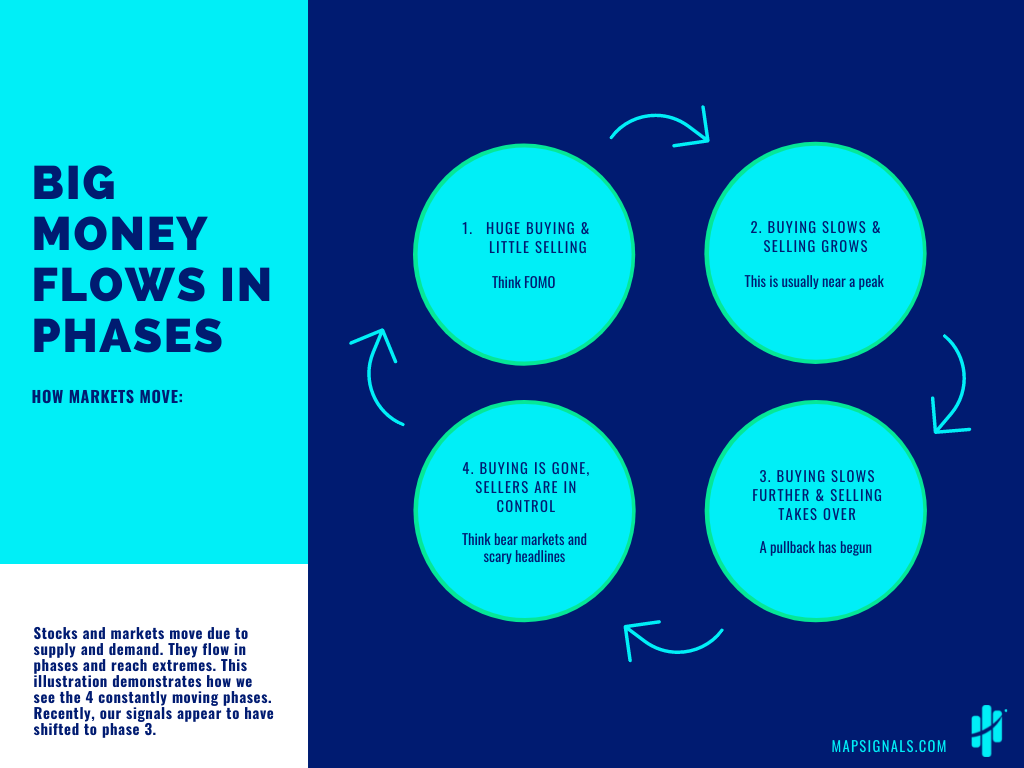
Only recently we’ve shifted to phase 3. That’s when buying slows a lot and selling takes over.
Scary as this may seem, it’s how markets work. Nothing goes straight up forever. If you worked 24 hours a day without sleep or rest, you’d likely get a ton accomplished. But you’d also die after not too long.
Market pullbacks are like breaks for stocks: They are healthy and necessary. But the great news is this: Pullbacks are usually great buying opportunities.
Planning is paramount. More on that in a bit.
Let’s dig into some charts now…
Big Money Index Says Stocks Are Going Down
Sometimes data shifts are subtle while other times they’re obvious. One look at the Big Money Index and you’ll see there’s a big disconnect going on with stocks.
As a reminder, the BMI measures big buying and selling in stocks. It typically moves before the market. Clearly it fell out of bed the last month, but the indexes kept grinding higher:
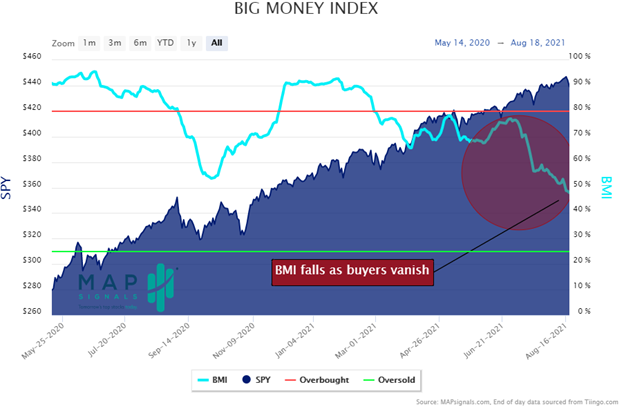
That means that over the past 5 weeks, there’s been more stock selling than buying. As it stands, the BMI fell to 48% this morning. When it falls hard, it’s usually a message that stocks are going down.
Subscribers can track the BMI daily here. The BMI is our top-level view showing buyers drying up as sellers increase.
Below is our Big Money Stock Buys & Sells chart. The data is deteriorating:
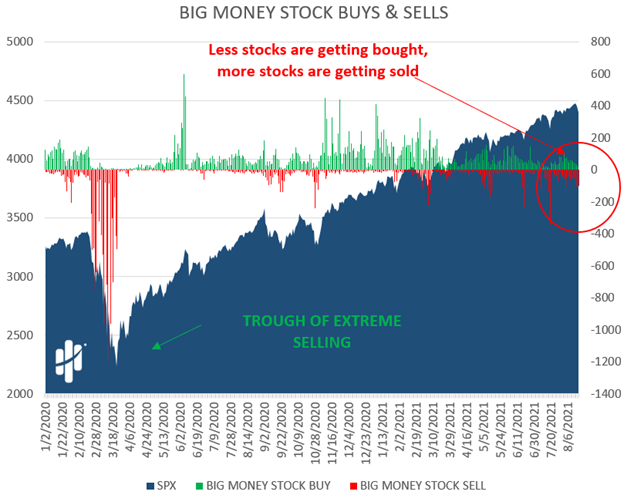
It shows us how breadth is thinning. Green bars (buyers) are getting shorter while red bars are expanding:
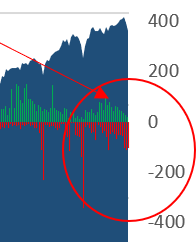
From this vantage point, it’s so clear. There’s a growing wave of selling hitting stocks: gaining strength for weeks.
We see the same patterns in ETFs.
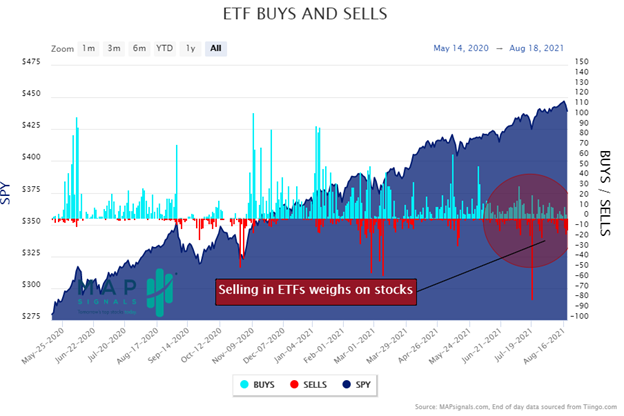
If our data could speak, it’d say stocks are going down. Summers are notorious for icky selloffs, and it appears we’re heading for one soon.
So, what’s one to do? Well, if you’re an active trader type, maybe trim up some non-core positions. Raise cash and wait to jump back in once the data shows sellers slowing.
If you’re a long-term investor like we are, build a buy-list. That was last week’s message in our post, Which Stocks Do I Buy. We like to look at prior outlier stocks that’ve pulled back.
A great place to search for those is our monthly MAP 50 report. These are the 50 highest quality stocks seeing the most Big Money buying the last 6 months. And our last MAP 50 was released on Sunday. We see this list of stocks as a great area to do some focused investing homework.
Many people get freaked out by sloppy selloffs. But the longer you hang around markets, you come to understand that they happen. And they can happen almost instantly too if you’re focused on the news. But isn’t it nice to know you have data that has been warning about this since weeks ago?
So, the big question is when is it time to buy? For us, the answer again lies in our data. We’d need to see either:
- extreme selling indicating a washout has occurred.
- or we’d need to see buyers pick up.
Maybe that comes today, next week, or a month from now. One thing is sure though, our data says stocks are going down.
Maybe that makes us near-term bearish which seems contrary to our perma-bull nature.
If so, we’d call ourselves happy bears. The kind that root for lower prices so we can scoop up great deals before they vanish. Buying amazing stocks at fire sale prices makes these near-term bears smile.
***And if you want to see how MAPsignals finds awesome stocks, check out our latest video: Best Stocks to Buy Now for September 2021.
When markets head south, Jason looks to OG outliers for opportunity.
Make sure to like and subscribe to our YouTube channel!