• Menu
  • Skip to right header navigation
  • Skip to main content
  • Skip to primary sidebar
  • Skip to footer

MAPsignals

We map big money.

  • Latest Insights
  • Power of MAP
    • MAP Products
    • MAP System
    • White Papers
    • Videos & Interviews
  • Profit with MAP
  • About
    • About MAP
    • MAP Team
    • Authors
    • MAP System
    • MAP Products
    • Big Money Index
  • Members
    • Get Started With MAP
    • My MAP
    • Big Money Charts
    • MAP View
    • MAP View Options
    • MAP Top 20 Weekly
    • MAP 50
    • Member Updates
    • Platinum Updates
    • Members Only Posts
    • Performance
  • Portal

Stocks Bounce From Oversold Levels

June 1, 2022 //  by Lucas Downey//  2 Comments

If you want to divide a room, ask a group of investors their forecast on the market in 2022.

If you want an unemotional narrative of the stock market, follow data. Today’s message is simple: Stocks bounce from oversold levels.

Stocks Bounce From Oversold Levels

There’s every reason in the world to NOT own stocks. Let’s run through a few of the fears: high inflation, rising rates, Russian war, and quantitative tightening (QT). I feel like I can go on and on, but you get my drift.

But following data has a way of telling a different narrative … an emotionless story. As I’ll show you, the data is getting more bullish. And the Big Money trends keep working.

Let’s get to it.

Stocks Bounce from Oversold Levels

The Big Money Index reached lows last week. Wednesday morning (May 25th) signaled oversold conditions.  That’s our most bullish near-term signal. Usually when it hits, valuations are attractive. We haven’t seen this level of selling since March 2020.

But get this, since then the BMI has rallied to 32%. Check it out:

BMI breaks above oversold line | Big Money Index

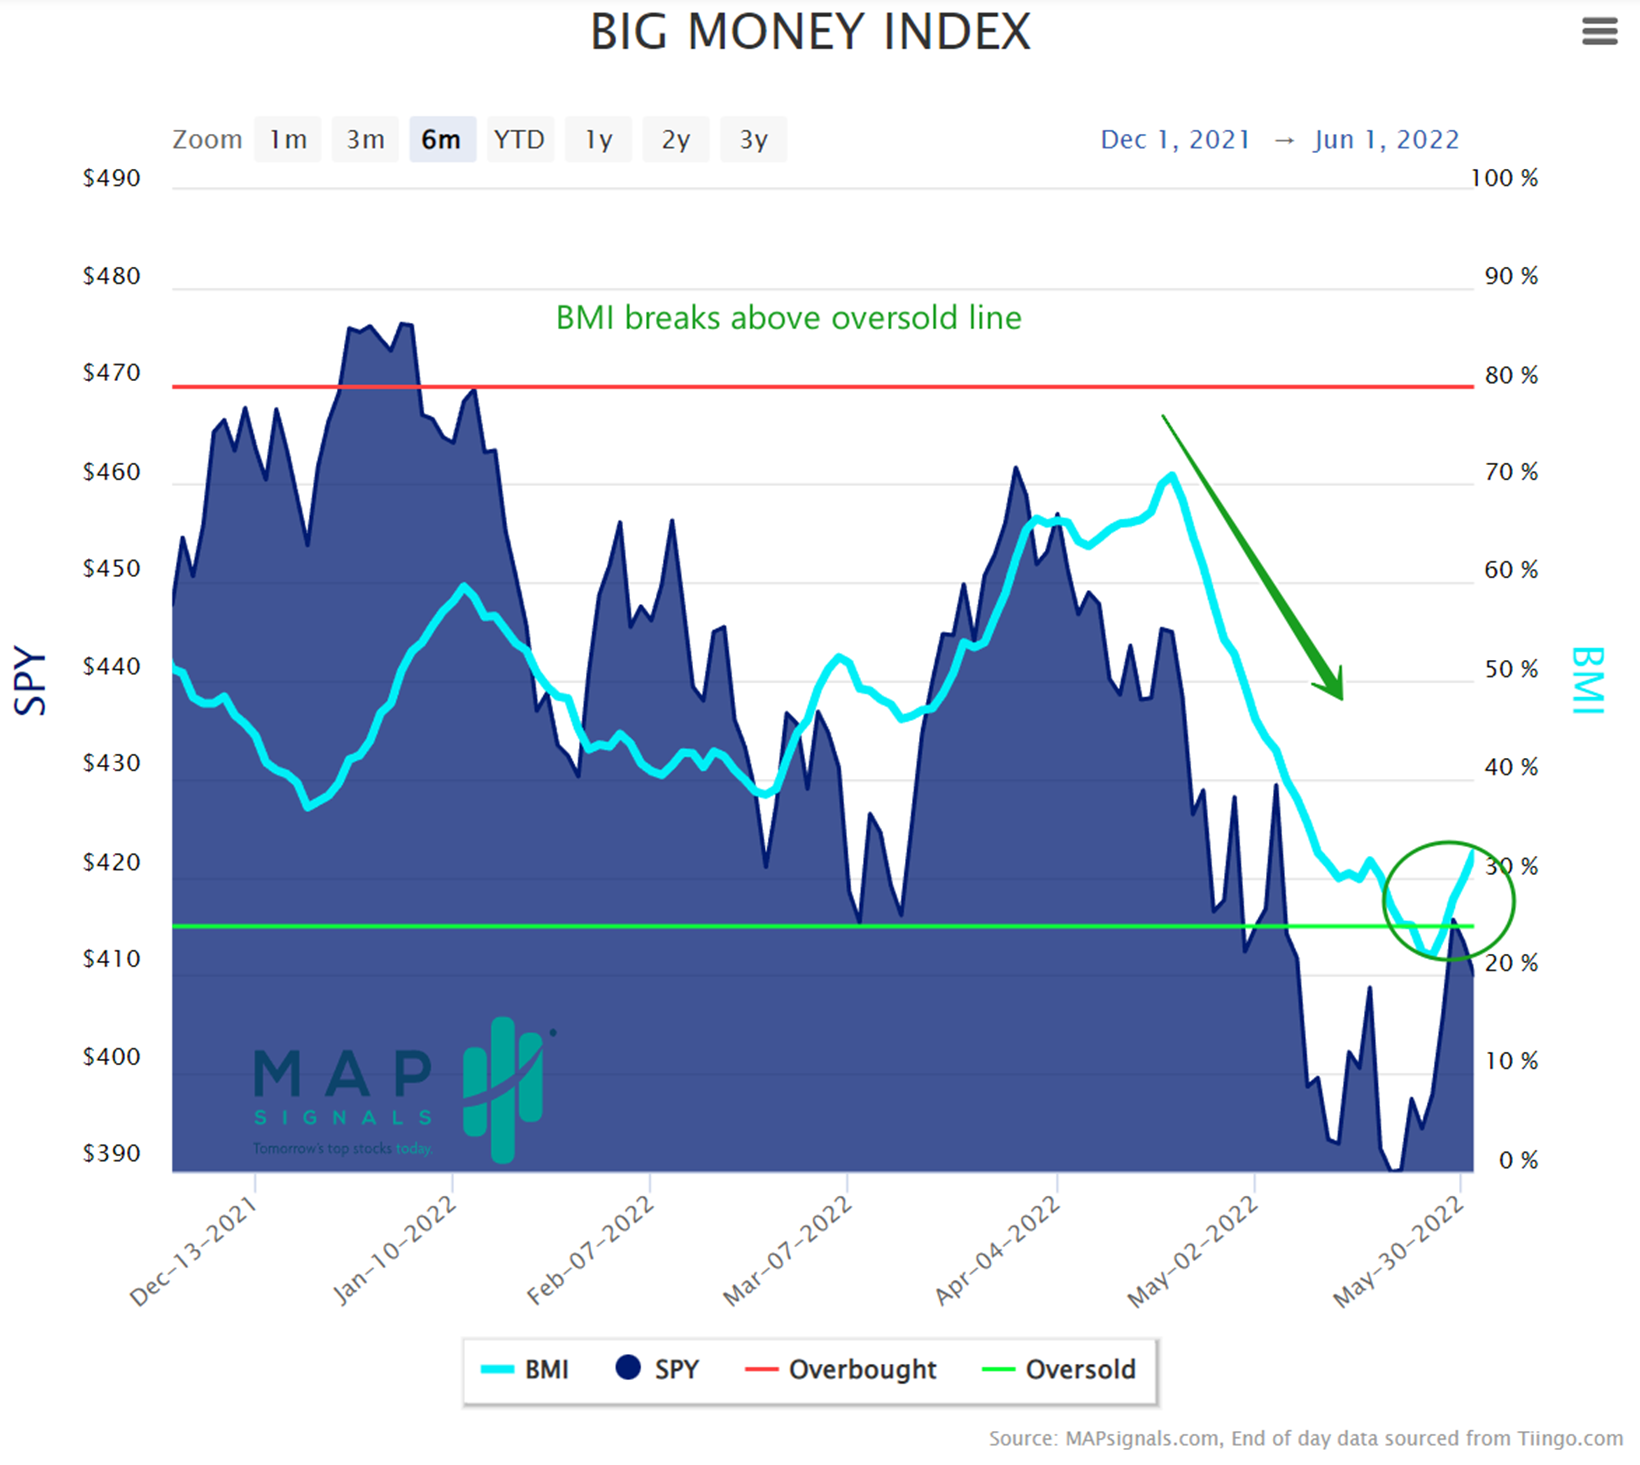
A week ago, the BMI fell to 22% (25% and lower is oversold) and as of this morning sits at 32%. A rising BMI tells us either that buyers are back OR that massive selling in stocks has slowed. As I’ll show you, the recent bounce from May 25th is due to the latter.

If you want to see a rally, traders must stop pressing the sell button. And they have. Below you’ll see how selling has vanished since Tuesday May 24th:

Big Money stock buys and sells | BMI ramping due to less de-risking

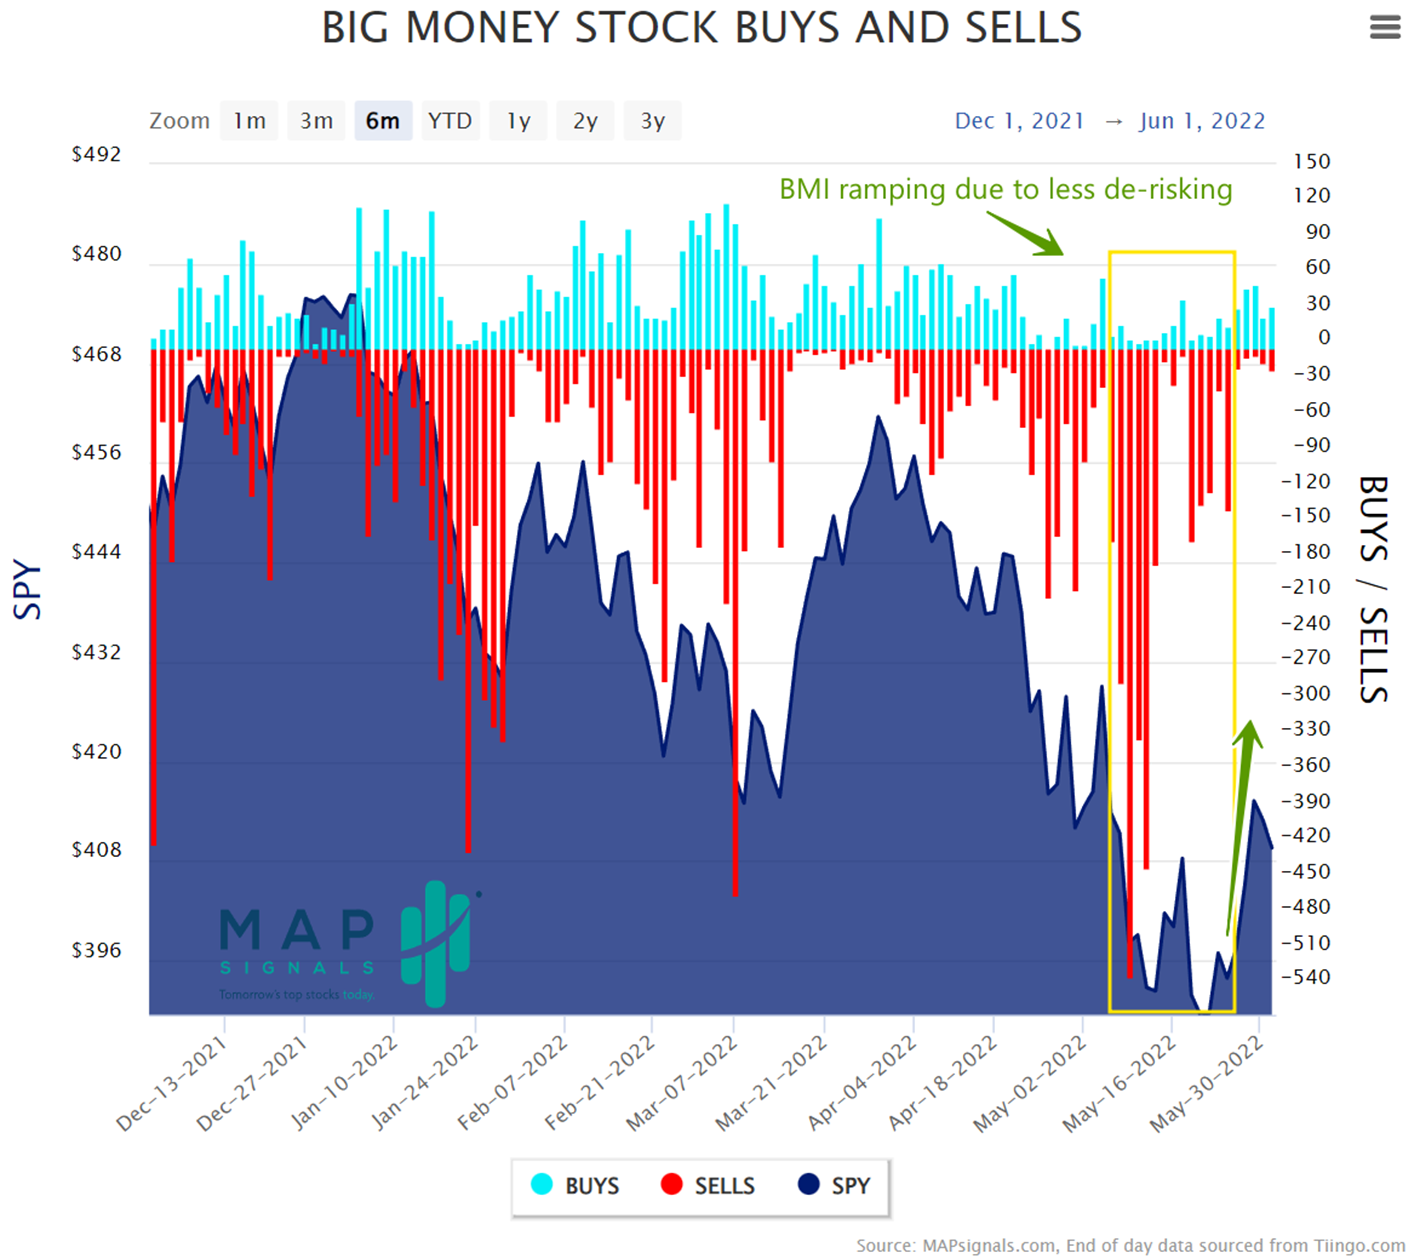
Since those big red bars stopped, markets flew higher. That’s how the market works. Capital continuously rotates in phases like waves in the ocean. But when everything gets sold in unison like recently, violent snapbacks can occur.

As a reminder, here are the flowing phases of Big Money:

  1. Huge buying and little selling
  2. Buying slows and selling grows
  3. Buying is gone, sellers are in control
  4. Selling slows, and buying grows

Below is a diagram. If the BMI keeps rising further, we would be exiting phase 4:

Big Money flows in phases

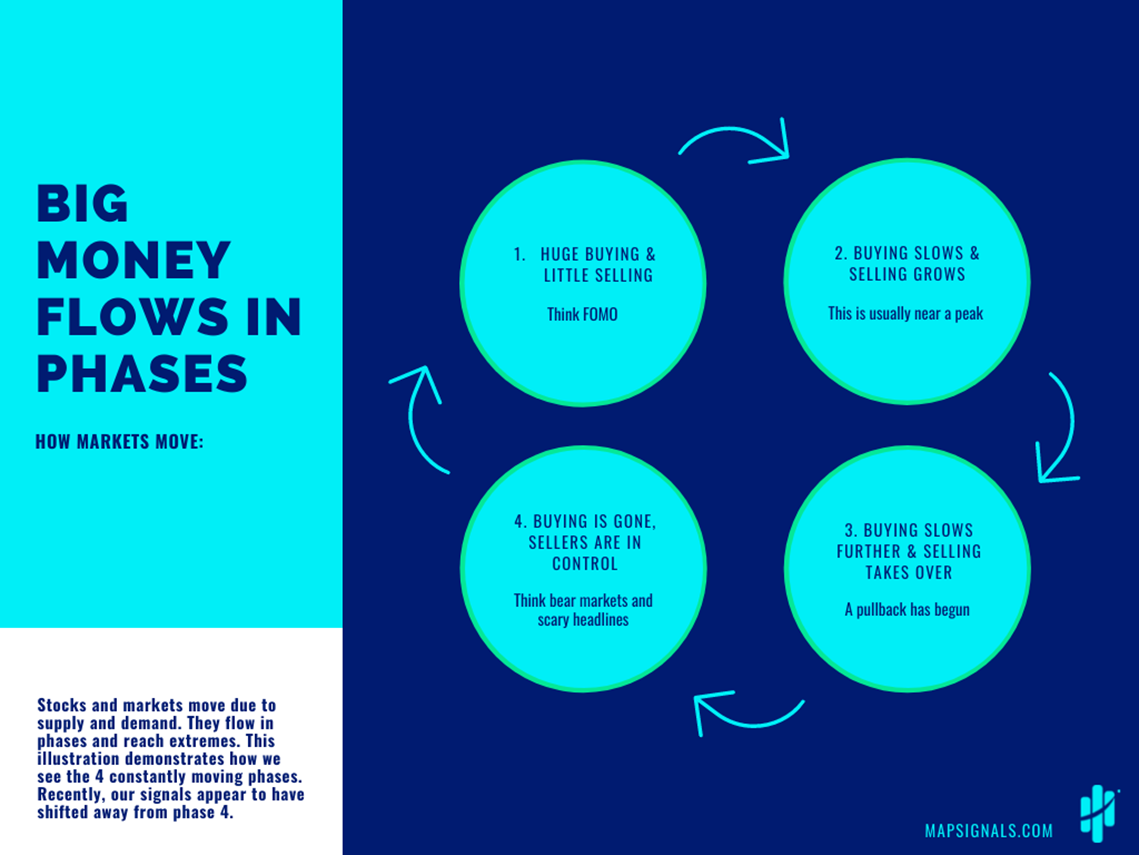
This image demonstrates the cyclicality of markets. We just witnessed extreme levels of selling and now the relief rally has started. We’ll need more data to flow through before buyers show up.

Selling must exhaust itself … and signs are pointing to that being the case. Until the BMI stops lifting, markets could keep climbing in the short-term.

Now let’s look at where our data has been finding promise lately.

MAPsignals Stocks Outperform

Normally when the BMI ramps from oversold I beat the bull drums from the mountaintops. Today, however, I’m beating them from the oil patch. Here’s why.

Every week our process profiles the Top 20 stocks getting bought by Big Money. These are stocks that score high fundamentally with growing sales and earnings. Out of 500 stocks that get bought and sold each week, these are top shelf!

But to isolate the stellar leaders over time, we have a monthly process that ranks the 50 stocks getting bought the most over the prior 6 months. This is where we find the outlier stocks in our process.

Well, the MAP 50 for MAY has been performing very well, more than doubling the S&P 500 (SPY ETF) in the last few weeks. That’s due to it’s 26% concentration in Energy and 10% weighting in materials names.

Check out the performance below:

MAP Portfolio vs SPY | MAP 50 outperforms SPY ETF

That electric blue line is the average performance of the May basket, with a 6.44% gain … easily beating the market’s ramp of 2.37%. That outperformance is mainly a result of oil and gas stocks raging, literally since January. So, while the market stages a relief rally, Big Money favorites are juicing even higher.

Many of them are still breaking out as stocks bounce from oversold levels. While headlines remain dreary, the Big Money process spots the promise.

Let’s wrap up.

Here’s the bottom line: I’ve repeatedly stated how oversold markets are generally great opportunities to buy beaten down companies. It’s a rare gift to investors and 2022’s pullback is falling in line with that narrative given the bounce we’re seeing.

As de-risking grinds to a halt, stocks rise. That’s very positive.

For a true bottom to form in stocks, we’ll need to see macro headwinds dissipate. Eventually they will. Then buyers will step in.

My bet is the Big Money will lead the shift.

***And if you’re ready to kick your investing game up a notch, get started with a MAPsignals subscription today. Let data be your edge!

Lucas Downey
Lucas Downey

Lucas is co-founder of MAPsignals. His full bio can be found here.
Prior to MAP, he was Head of ETF Sales at Cantor Fitzgerald & SVP of Derivatives at Jefferies, LLC.

Spread the word!

Category: All, Big Money Insights Weekly

Previous Post: «MAPPING BIG MONEY FLOWS SUPERCHARGES INVESTMENTS Mapping Big Money Flows Supercharges Your Investments
Next Post: Best Growth Stocks to Buy Now for June 2022 »

Reader Interactions

Comments

  1. Richard

    June 3, 2022 at 8:34 am

    On the Big Money sector charts there are two lines included: the Buy SMA 25 and the sell SMA 25. Each line has an associated positive or negative number for the day, example Buys 25 SMA .72, Sells 25 SMA -20.64. Can you explain this information or direct me to the information?

    Reply
    • MAPsignals Staff

      June 3, 2022 at 8:52 am

      Hi Richard,
      Those lines are 25-day moving averages of buys and sells. The idea is to show peaks and valleys of extreme buys and sells over time. When selling exhausts, the sell line will move up. When buying is extreme, the line will fall.
      Hope this helps !

      Reply

Leave a Reply Cancel reply

Your email address will not be published. Required fields are marked *

Primary Sidebar

Get Big Money Insights for FREE

Want to know where the Big Money is headed?

Just enter your email address below. You'll get our FREE NEWSLETTER sent directly to your inbox.

We call it Big Money Insights... It’s your weekly sneak peek at the powerful market-moving forces that are hidden from 99% of investors.

"*" indicates required fields

This field is for validation purposes and should be left unchanged.

Categories

  • All
  • Big Money Insights Weekly
  • Big Money Series
  • Macro Insights
  • MAP In The Media
  • Members Only
  • Performance
  • Podcast
  • Special Reports
  • Stocks
  • Videos & Interviews
  • White Papers

Archives

  • June 2022
  • May 2022
  • April 2022
  • March 2022
  • February 2022
  • January 2022
  • December 2021
  • November 2021
  • October 2021
  • September 2021
  • August 2021
  • July 2021
  • June 2021
  • May 2021
  • April 2021
  • March 2021
  • February 2021
  • January 2021
  • December 2020
  • November 2020
  • October 2020
  • September 2020
  • August 2020
  • July 2020
  • June 2020
  • May 2020
  • April 2020
  • March 2020
  • February 2020
  • January 2020
  • December 2019
  • November 2019
  • October 2019
  • September 2019
  • August 2019
  • July 2019
  • June 2019
  • May 2019
  • April 2019
  • March 2019
  • February 2019
  • January 2019
  • December 2018
  • November 2018
  • October 2018
  • September 2018
  • August 2018

Follow us on Twitter

MAPsignals Follow 619 842

MAPsignals is a data platform that tracks institutional money flows in and out of the market.

mapsignals
mapsignals avatar; MAPsignals @mapsignals ·
30 Jun 1542518642461384709

The first half of 2022 is in the books.

The #bearmarket has sent #stocks tumbling.

Today, @LukeDowney reviews how sectors performed YTD and highlights two #sectors primed for upside. $XLY $XLK

Read here: https://mapsignals.com/map-blog/two-sectors-are-primed-for-upside/

Image for the Tweet beginning: The first half of 2022 Twitter feed image.
Reply on Twitter 1542518642461384709 Retweet on Twitter 1542518642461384709 0 Like on Twitter 1542518642461384709 1 Twitter 1542518642461384709
Load More...

Subscribe To Our YouTube Channel

MAPsignals

MAPsignals
#Capitulation #BearMarket2022 #StockMarketSelloff
Stock market capitulation is here. In this video, Luke dives into what capitulation is and what it means for stocks. Check out our latest blog post: https://mapsignals.com/map-blog/

What does capitulation mean for markets? It is when there's no leadership and investors throw in the towel. You've heard the saying, "sell first, ask question later?" That's how Wall Street thinks.

But these rare moments often lead to bargains for stocks. Capitulation can often lead to bottoms being formed in stocks.

As Lucas Downey shows, these moments are usually when investors should focus on quality companies in this bear market environment. Long-term is the best mindset in a bear market.

The best stock market analysis we've found is following the Big Money. MAPsignals doesn't argue with data.

Learn more at www.MAPsignals.com
Remember this is not personal investment advice of any kind. This video is for entertainment purposes only. Our focus is to help investors make sense of markets with data.

Our disclaimer can be found here: https://mapsignals.com/contact/

Music by Karl Casey @ White Bat Audio
Stock Market Capitulation is Here | Bear Market 2022
YouTube Video UC4nueJix0bSLmZyilUuCVrQ_xzXHj_aJvss
Load More... Subscribe

Footer

© 2021 Mapsignals.com

  • Home
  • Contact & Disclaimer
  • Privacy Policy
  • Terms & Conditions
  • Cookie Policy (US)
  • FAQ

Copyright © 2022 · Mai Law Pro on Genesis Framework · WordPress · Log in

✕
What Happened to Risk Assets White Paper is Here

Get your copy here and take a journey through our thoughts on margin and leverage.

Enter your email address below and you'll get our FREE NEWSLETTER sent directly to your inbox. 

 We call it Big Money Insights... It’s your weekly sneak peek at the powerful market-moving forces that are hidden from 99% of investors.

Manage Cookie Consent
We use cookies to optimize our website and our service.
Functional Always active
The technical storage or access is strictly necessary for the legitimate purpose of enabling the use of a specific service explicitly requested by the subscriber or user, or for the sole purpose of carrying out the transmission of a communication over an electronic communications network.
Preferences
The technical storage or access is necessary for the legitimate purpose of storing preferences that are not requested by the subscriber or user.
Statistics
The technical storage or access that is used exclusively for statistical purposes. The technical storage or access that is used exclusively for anonymous statistical purposes. Without a subpoena, voluntary compliance on the part of your Internet Service Provider, or additional records from a third party, information stored or retrieved for this purpose alone cannot usually be used to identify you.
Marketing
The technical storage or access is required to create user profiles to send advertising, or to track the user on a website or across several websites for similar marketing purposes.
Manage options Manage services Manage vendors Read more about these purposes
View preferences
{title} {title} {title}