• Menu
  • Skip to right header navigation
  • Skip to main content
  • Skip to primary sidebar
  • Skip to footer

MAPsignals

We map big money.

  • Latest Insights
  • Power of MAP
    • MAP Products
    • MAP System
    • MAP White Papers
    • Videos & Interviews
  • Profit with MAP
  • About
    • About MAP
    • MAP Team
    • Authors
    • MAP System
    • MAP Products
    • Big Money Index
  • Members
    • Get Started With MAP
    • My MAP
    • Big Money Charts
    • MAP View
    • MAP View Options
    • MAP Top 20 Weekly
    • MAP 50
    • Member Updates
    • Platinum Updates
    • Members Only Posts
    • Performance
  • Portal

Waiting In The Wings

October 29, 2020 //  by Lucas Downey//  Leave a Comment

6 more days folks… election day is almost here.

We’re all squirming with anticipation and I speak for myself and perhaps most of us when I say, I just want it over with. Big Money is likely thinking the same way… looking at our data and history, they are likely waiting in the wings until we get a decision either way.

WAITING IN THE WINGS

And that makes sense, right? Big money managers want to bet on as much certainty as they can. And close elections with a history of surprise is anything but certain. Why take unnecessary risk? Isn’t it better to reduce risk while waiting in the wings until we get a decision?

Yesterday’s ugly selloff was largely attributed to the worldwide spike in COVID-19 cases. The failure to reach stimulus resolution before the election could also contribute.

Whatever the news says, we here believe that Big Money waiting it out is the main reason. As we’ll go into, Big Money acts like the ballast in the market. When they leave, it opens the space up to more volatility. When the cat’s away the mice will play.

For now, just know that when you are focused on data like we are at MAPsignals, the evidence suggests this is what we would expect heading into the election.

The election trade works like this: They tend to dump ‘em before they bump ‘em. That’s exactly what we saw starting in August and hitting like a ton of bricks yesterday.

Big Money Index Is Waiting In The Wings

Let’s start from the top and work our way down. The Big Money Index is muted.

There is a downtrend visible from the June peak. The market finally followed suit in September. That gave way to an October bounce. But since October 12th, we’ve been range-bound.

bmi waiting in the wings

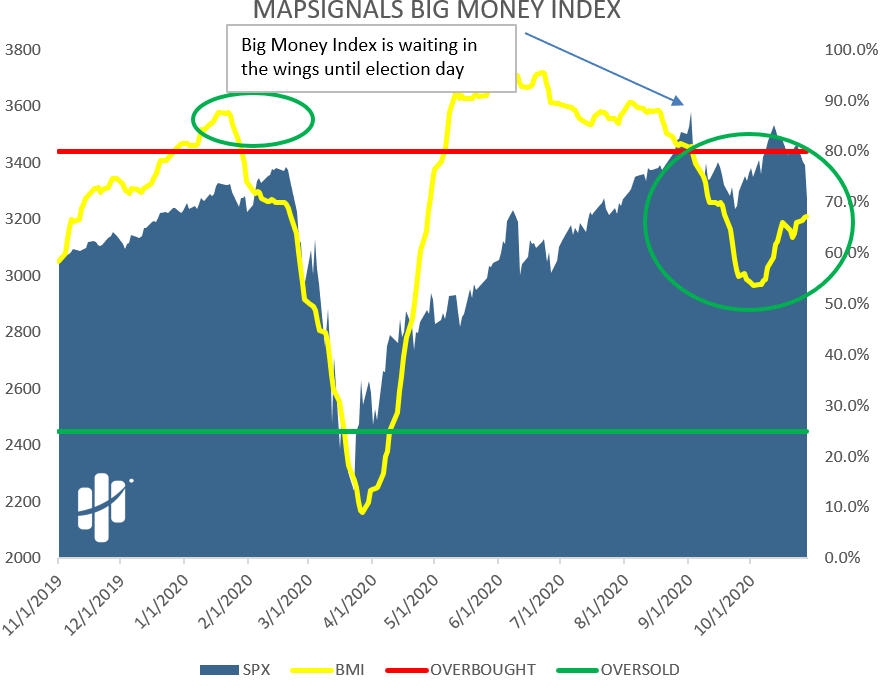
Now, you may be wondering why the BMI isn’t falling after we’ve seen clear selling this week. That’s because the BMI is a 25-day moving average of our Big Money buy and sell signals. 25 days is about 5 weeks ago, and that was the mini-Tech Wreck we saw in late September.

So, yesterday’s action has yet to put pressure on the BMI. Some of that action we described as weak hands.

But, if the BMI doesn’t tell the full story of what’s happening below the surface, we must keep working our way deeper into our data. Needless to say, there were chunky sellers yesterday.

Pre-Election Selling In Stocks Is Here

Let’s look at a daily view of market action. Yesterday saw the single largest day of selling since the March 23rd low. That’s significant.

Below are the daily Big Money Stock Signals of buys and sells. Each day we net out the buyers and sellers.

If a bar is green, buyers won the day. If it is red, like yesterday, the sellers took control:

big money stock signals

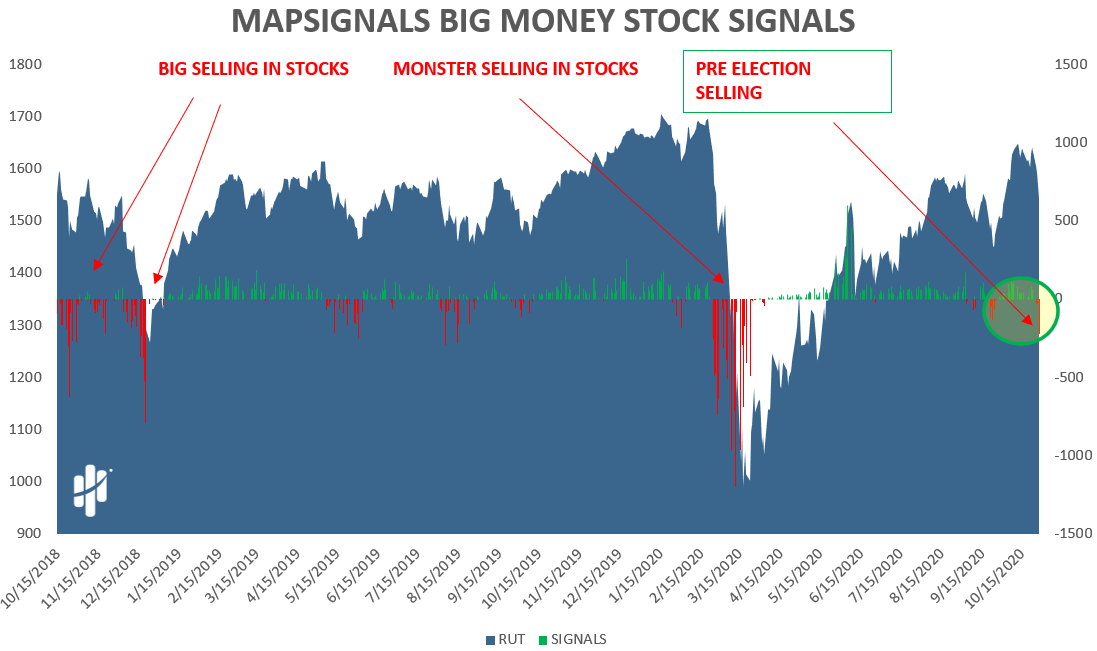
What sticks out to us is how much larger the selling was yesterday compared to September’s action. Let’s do a zoom-in:

big money stock signals zoom in

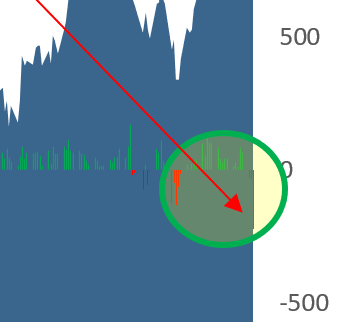
And those were not the only red signals we saw yesterday.

ETF Selling Increases Ahead Of Election

Heading into this week it was eerily quiet. We called it quiet chop. We told you how indexes appeared muted, but under the surface things were more volatile.

One great way to see that is via ETFs. Look at the big chucky selling we saw yesterday.

Green bars indicate the number of buys and red are sells. We’ve circled yesterday’s selling off to the right. It’s the single largest day of selling since the March 23rd low:

ETF selling increases ahead of election

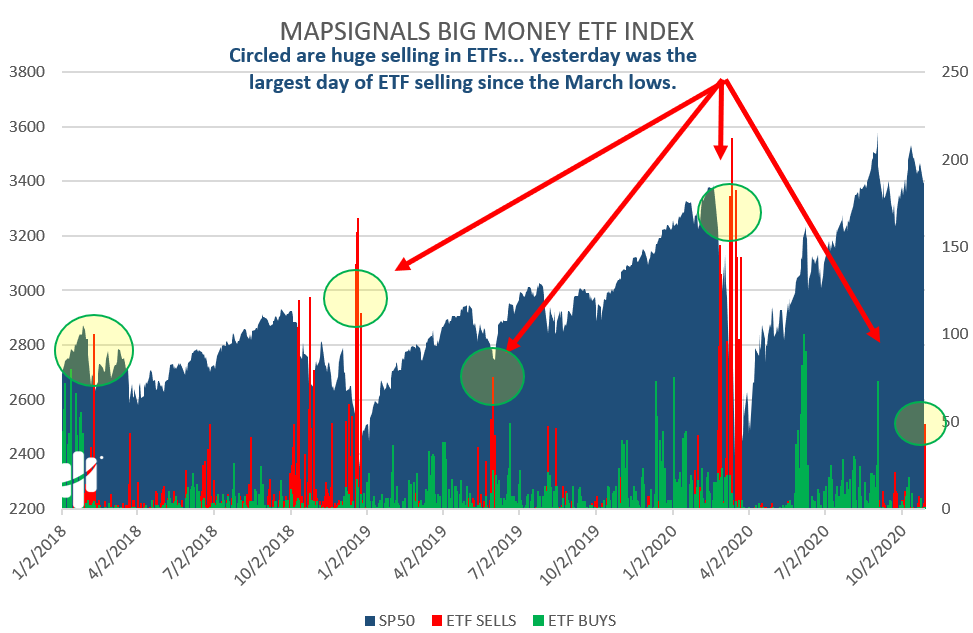
This type of activity is risk-off…

If you ask me, it looks like money managers are waiting in the wings.

At the start of this post, I discussed the Big Money acting as a market ballast. Old tall ships needed literally tons of weight or ballast in the bottom of the hull to stabilize the boat in the water.  If there wasn’t enough weight, the boat rocked back and forth or even toppled over.

Big Money is the market’s ballast. Several studies have found that up to 90% of daily stock trading are big institutions. So, if they take their chips off the table for the most part, the ballast is taken away.

This opens the door for volatility. When the cat’s away, the mice will play. Algorithmic traders will test liquidity- especially on bad news days like yesterday’s COVID spike. If they try to sell some stock and there are no buyers (no ballast) price drops happen faster and easier. Selling intensifies because there’s no one there to shore up the markets.

When Big Money isn’t around to take on risk, the shock absorbers are just gone. And things can spiral quickly.

That’s what I believe we saw yesterday: uncertainty setting the stage for the Big Money to exit to the wings. Then when some negative news hits, the shenanigans begin. High Frequency traders jump in and go to work… after all, highly volatile days are usually when HFT firms make most of their money.

And while this all may be unsettling for you, this pre-election action follows our narrative to a “T”. If you haven’t read it yet, our new BMI white paper looks back in history at every election since 1992, and the pattern that emerges is clear. Big Money sells ahead of the election, and buys after the outcome is known.

The Bottom Line is this: sometimes there are bulls, and other times there are bears. Election years offer plenty of uncertainty prior to the vote. So, headed into November 3rd, we expected a volatile, even short-term bearish setup. That’s what we are seeing.

But, that’s only half the story… once the election outcome is known (a clear winner) there’s historically a good chance that Big Money buyers will swoop back in.

Only time will tell if 2020 follows suit.

In the end though, it’s all secondary to Mapsignals’ one main axiom: we firmly believe that outlier stocks will continue to be great no matter what is thrown their way.

Elections are no different and are really just another 4-year bump in the road.

And history suggests Big Money is waiting in the wings until they can be clear on where to put their money.

All eyes on November 3rd…

Lucas Downey
Lucas Downey

Lucas is co-founder of MAPsignals. His full bio can be found here.
Prior to MAP, he was Head of ETF Sales at Cantor Fitzgerald & SVP of Derivatives at Jefferies, LLC.

Spread the word!

Category: All, Big Money Insights Weekly

Previous Post: « How To Find Outlier Stocks Early
Next Post: Post-election Playbook »

Reader Interactions

Leave a Reply Cancel reply

Your email address will not be published. Required fields are marked *

Primary Sidebar

Get Big Money Insights for FREE

Want to know where the Big Money is headed?

Just enter your email address below. You'll get our FREE NEWSLETTER sent directly to your inbox.

We call it Big Money Insights... It’s your weekly sneak peek at the powerful market-moving forces that are hidden from 99% of investors.

"*" indicates required fields

This field is for validation purposes and should be left unchanged.

Categories

  • All
  • Big Money Insights Weekly
  • Big Money Series
  • Macro Insights
  • MAP In The Media
  • Members Only
  • Performance
  • Podcast
  • Special Reports
  • Stocks
  • Videos & Interviews
  • White Papers

Archives

  • February 2023
  • January 2023
  • December 2022
  • November 2022
  • October 2022
  • September 2022
  • August 2022
  • July 2022
  • June 2022
  • May 2022
  • April 2022
  • March 2022
  • February 2022
  • January 2022
  • December 2021
  • November 2021
  • October 2021
  • September 2021
  • August 2021
  • July 2021
  • June 2021
  • May 2021
  • April 2021
  • March 2021
  • February 2021
  • January 2021
  • December 2020
  • November 2020
  • October 2020
  • September 2020
  • August 2020
  • July 2020
  • June 2020
  • May 2020
  • April 2020
  • March 2020
  • February 2020
  • January 2020
  • December 2019
  • November 2019
  • October 2019
  • September 2019
  • August 2019
  • July 2019
  • June 2019
  • May 2019
  • April 2019
  • March 2019
  • February 2019
  • January 2019
  • December 2018
  • November 2018
  • October 2018
  • September 2018
  • August 2018

Follow us on Twitter

MAPsignals Follow 1,434 1,061

MAPsignals is a data platform that tracks institutional money flows in stocks and ETFs. Sign up for free insights here: https://t.co/SaAVHjKC9J

mapsignals
mapsignals avatar; MAPsignals @mapsignals ·
54m 1621476848990359552

Pendulum has swung

Helene Meisler @hmeisler

Highest volume for the QQQs since 12/13

Reply on Twitter 1621476848990359552 Retweet on Twitter 1621476848990359552 0 Like on Twitter 1621476848990359552 0 Twitter 1621476848990359552
Load More...

Footer

© 2021 Mapsignals.com

  • Home
  • Contact & Disclaimer
  • Privacy Policy
  • Terms & Conditions
  • Opt-out preferences
  • FAQ

Copyright © 2023 · Mai Law Pro on Genesis Framework · WordPress · Log in

✕
What Happened to Risk Assets White Paper is Here

Get your copy here and take a journey through our thoughts on margin and leverage.

Enter your email address below and you'll get our FREE NEWSLETTER sent directly to your inbox. 

 We call it Big Money Insights... It’s your weekly sneak peek at the powerful market-moving forces that are hidden from 99% of investors.

MAPsignals
Manage Cookie Consent
We use cookies to optimize our website and our service.
Functional Always active
The technical storage or access is strictly necessary for the legitimate purpose of enabling the use of a specific service explicitly requested by the subscriber or user, or for the sole purpose of carrying out the transmission of a communication over an electronic communications network.
Preferences
The technical storage or access is necessary for the legitimate purpose of storing preferences that are not requested by the subscriber or user.
Statistics
The technical storage or access that is used exclusively for statistical purposes. The technical storage or access that is used exclusively for anonymous statistical purposes. Without a subpoena, voluntary compliance on the part of your Internet Service Provider, or additional records from a third party, information stored or retrieved for this purpose alone cannot usually be used to identify you.
Marketing
The technical storage or access is required to create user profiles to send advertising, or to track the user on a website or across several websites for similar marketing purposes.
Manage options Manage services Manage vendors Read more about these purposes
View preferences
{title} {title} {title}