• Menu
  • Skip to right header navigation
  • Skip to main content
  • Skip to primary sidebar
  • Skip to footer

MAPsignals

We map big money.

  • Latest Insights
  • Power of MAP
    • MAP Products
    • MAP System
    • MAP White Papers
    • Videos & Interviews
  • Profit with MAP
  • About
    • About MAP
    • MAP Team
    • Authors
    • MAP System
    • MAP Products
    • Big Money Index
  • Members
    • Get Started With MAP
    • My MAP
    • Big Money Charts
    • MAP View
    • MAP View Options
    • MAP Top 20 Weekly
    • MAP 50
    • Member Updates
    • Platinum Updates
    • Members Only Posts
    • Performance
  • Portal

Yearend Review for 2022

December 29, 2022 //  by Lucas Downey//  Leave a Comment

2022 is in the books. It was a memorable one for investors!

Today I’ll go over some of our most viewed posts in our yearend review for 2022.

Yearend Review for 2022

It’s always fun to look back. This year was all about the macro: rising rates, soaring commodity prices, war, oversold conditions, a strong dollar, lower valuations and more. Value sectors dominated in performance and our data.

MAPsignals put out a lot of great research to help navigate the challenging tides. We tackled many worries on investors’ minds and provided data-driven angles.

While we weren’t perfect, I can say that we did a respectable job in terms of performance and historical studies. I’m sure you’d agree there was a lot to cover in 2022!

Let’s now take a quick lap down memory lane at some of the bigger themes from this year.

Yearend Review for 2022

Without question, positioning and macro events dominated portfolios in 2022. Below are 14 of our most memorable insights from January through December.

Grab a coffee. I made a quick recap of each highlighted blog piece. Enjoy!

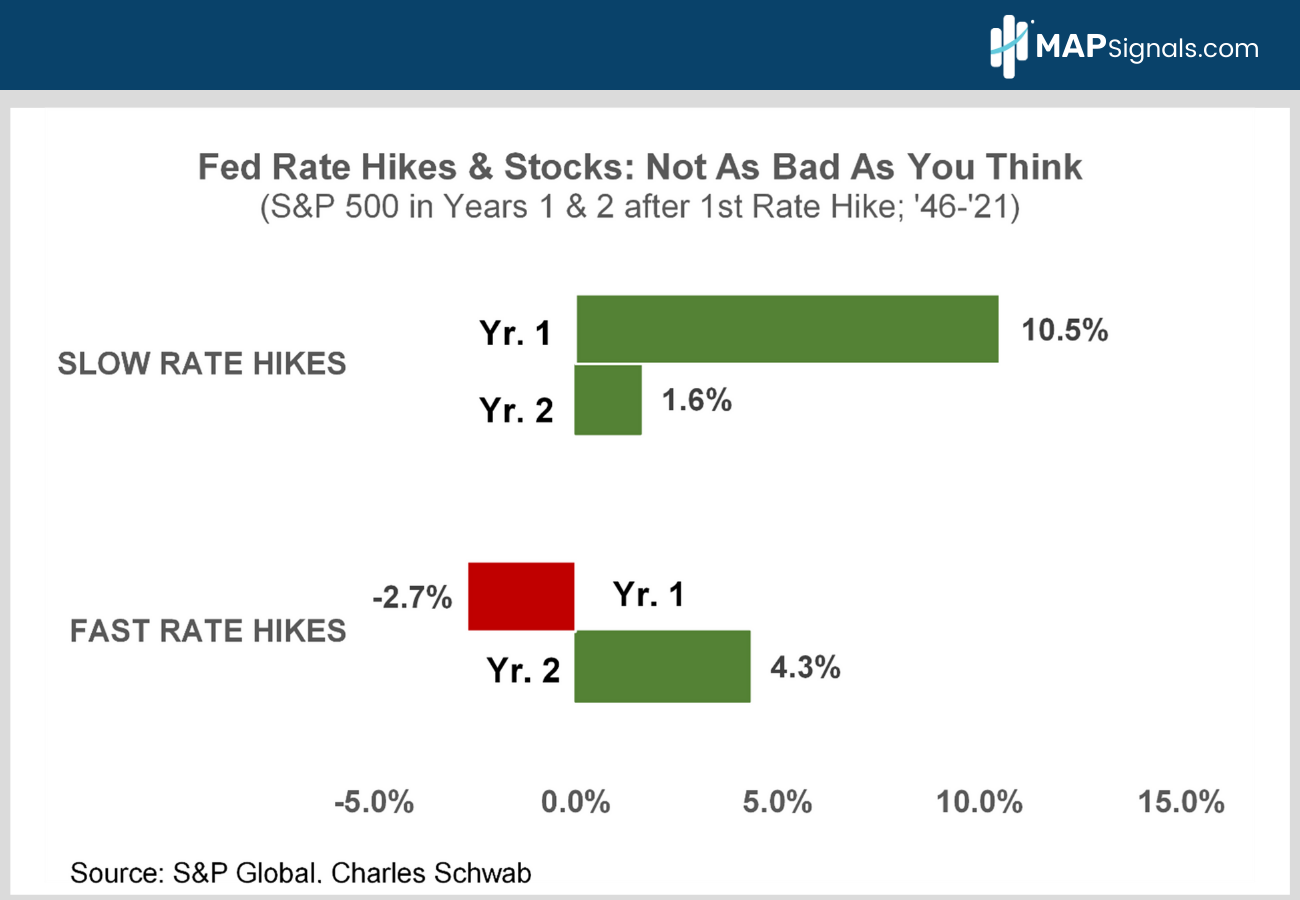
  1. In January, Alec Young kicked off an enlightening piece titled, Don’t Fear the Fed, where he showed how stocks performed historically given the pace of rate hikes.Fed Rate Hikes & Stocks - S&P 500 in Years 1 & 2 after 1st Rate Hike; '46-'21 | MAPsignals
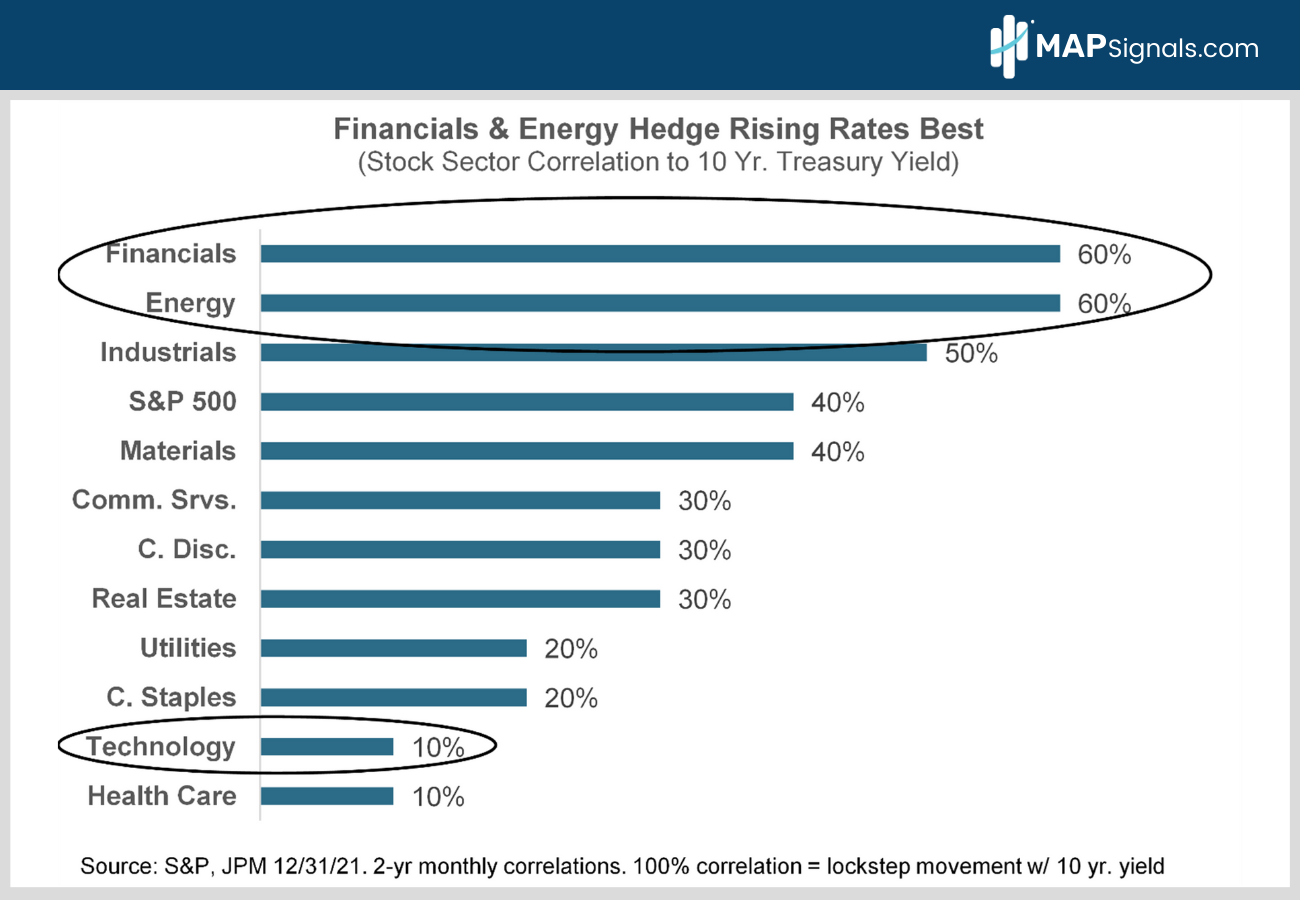
  2. Later that month, he asked a simple question: Which sectors perform well when rates rise? Energy, Financials, & Industrials fared the best. Notably, the energy group ranked highest all year in our data.2-yr monthly Stock Sector Correlations to 10 Yr. Treasury Yield | MAPsignals
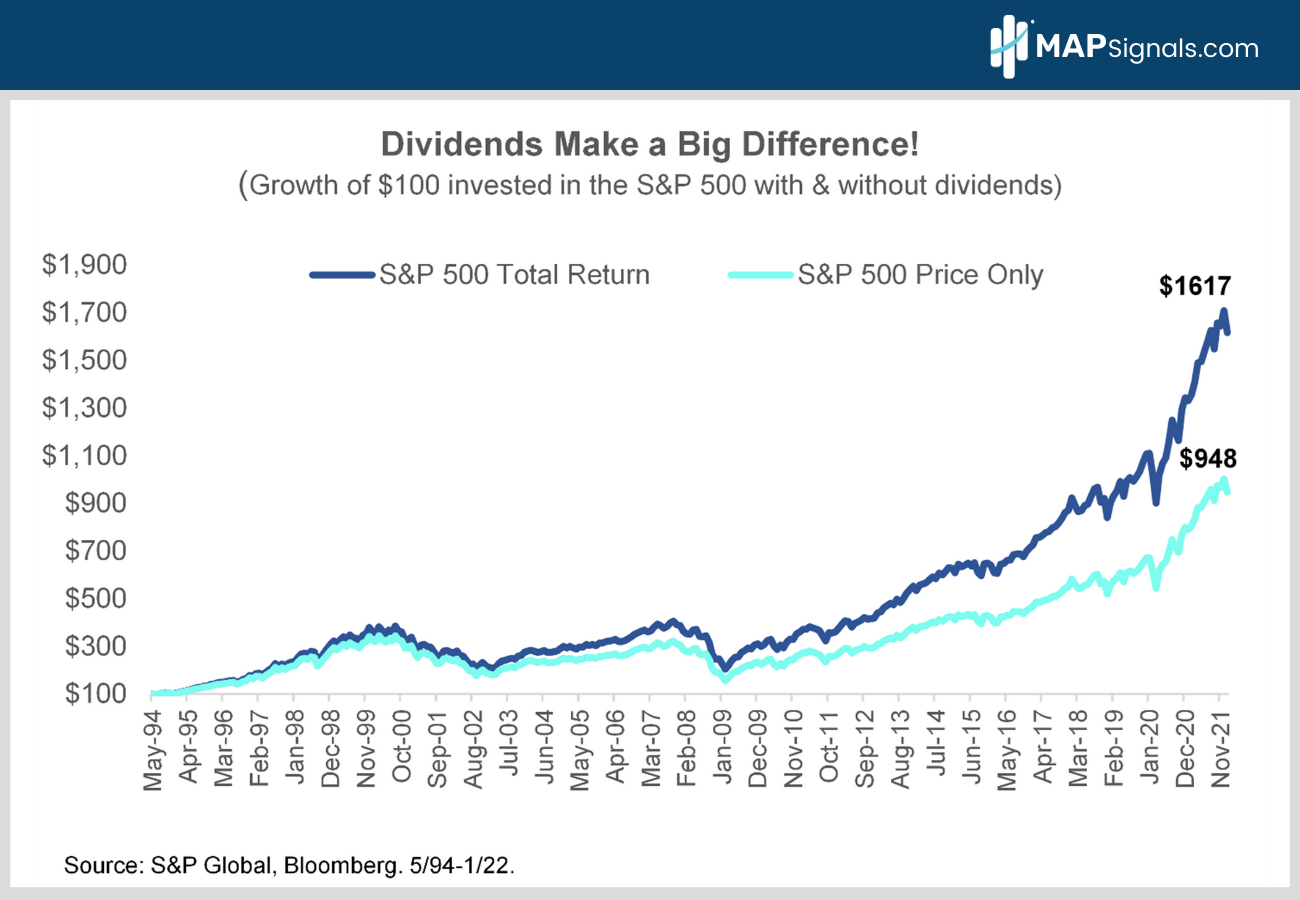
  3. Then in February, Alec reminded us of the power of dividends in a long-term portfolio. Reinvesting dividends since 1994 resulted in 70% more money compared to total return alone. Yes, dividends make a big difference:Growth Returns of $100 invested in S&P 500 with & without Dividends | MAPsignals
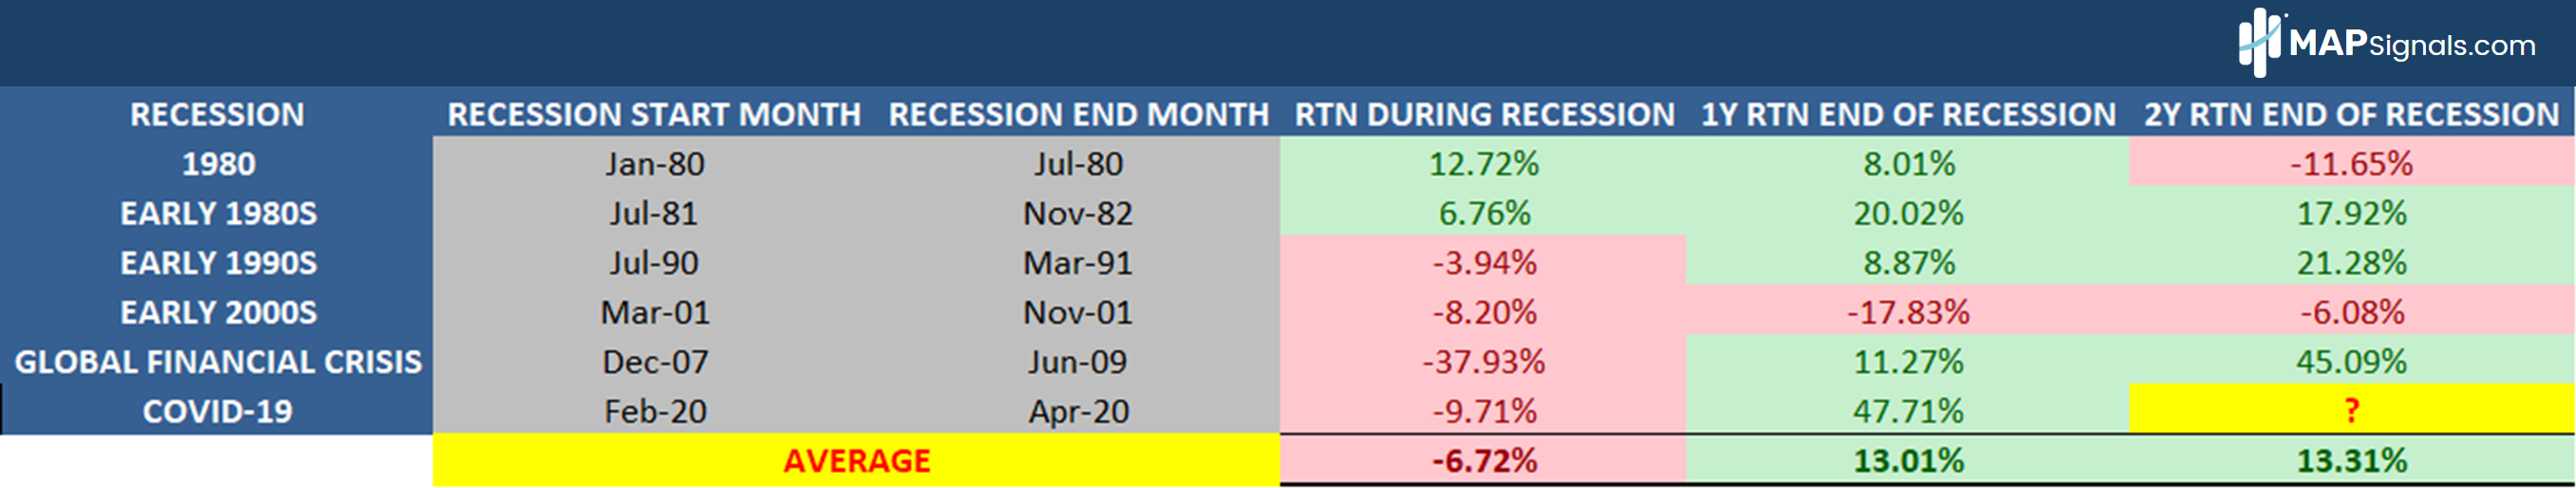
  4. Next, in March I made the case that investors shouldn’t fear recessions. While sectors were under pressure, like Technology, history shows that years following a recession are green on average since 1980:History shows that years following recessions are green on average since 1980 | MAPsignals
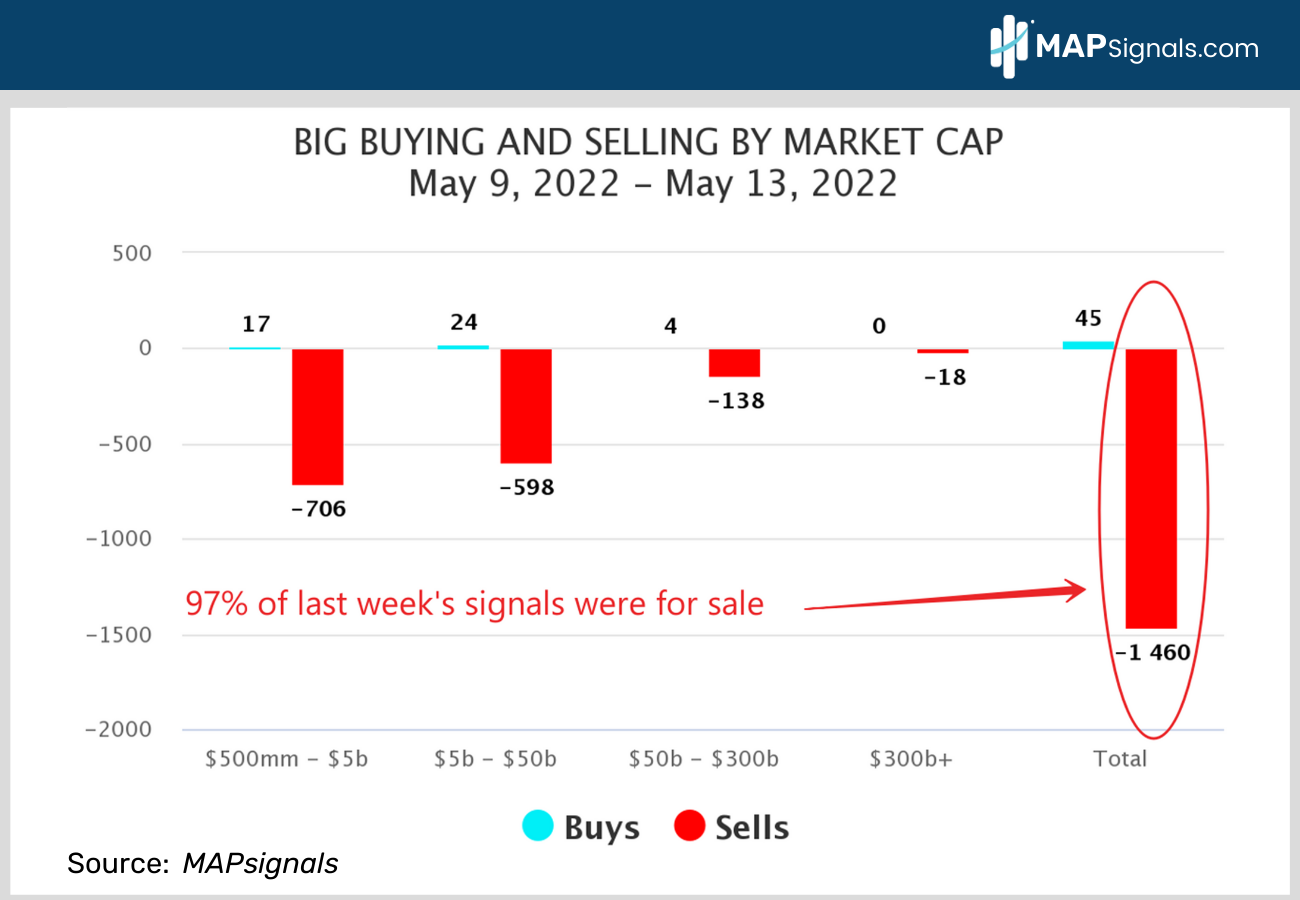
  5. Then in May, the Big Money Index reached oversold conditions. All sectors except for energy were sold hard, indicating a reversion bounce should come soon:Big Buying & Selling by Market Cap MAY 9-13, 2022 | MAPsignals
  6. Fast forward to July and market internals were improving, setting the stage for a rally. Health Care, Financials, & Industrial stocks were under heavy accumulation:Big Money Index breaks 3-month high as selling dwindles & buyers step in | MAPsignals
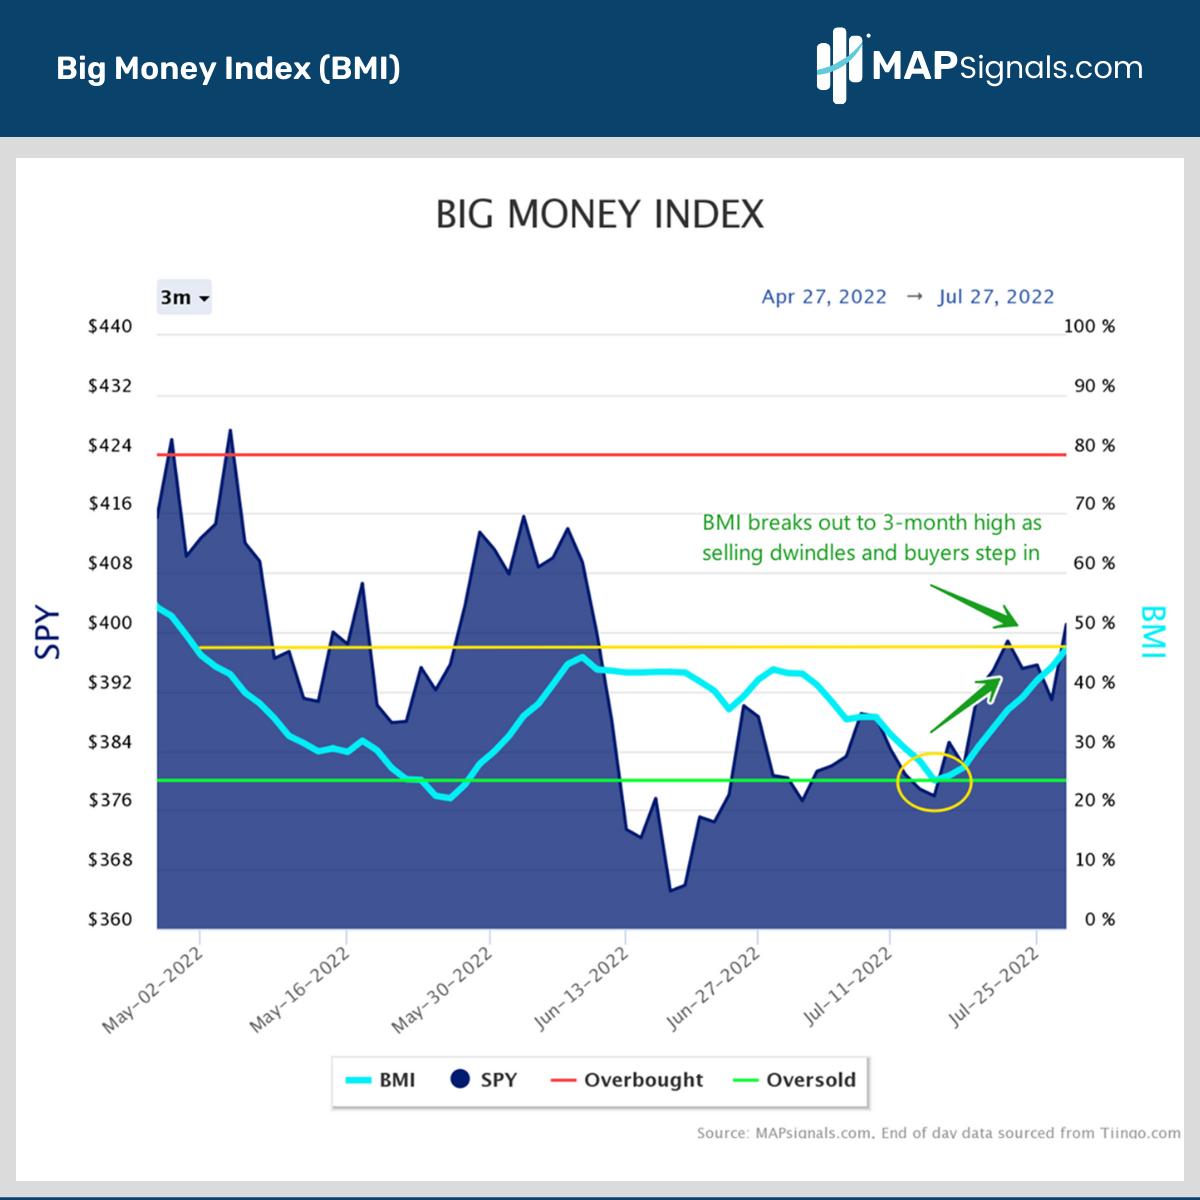
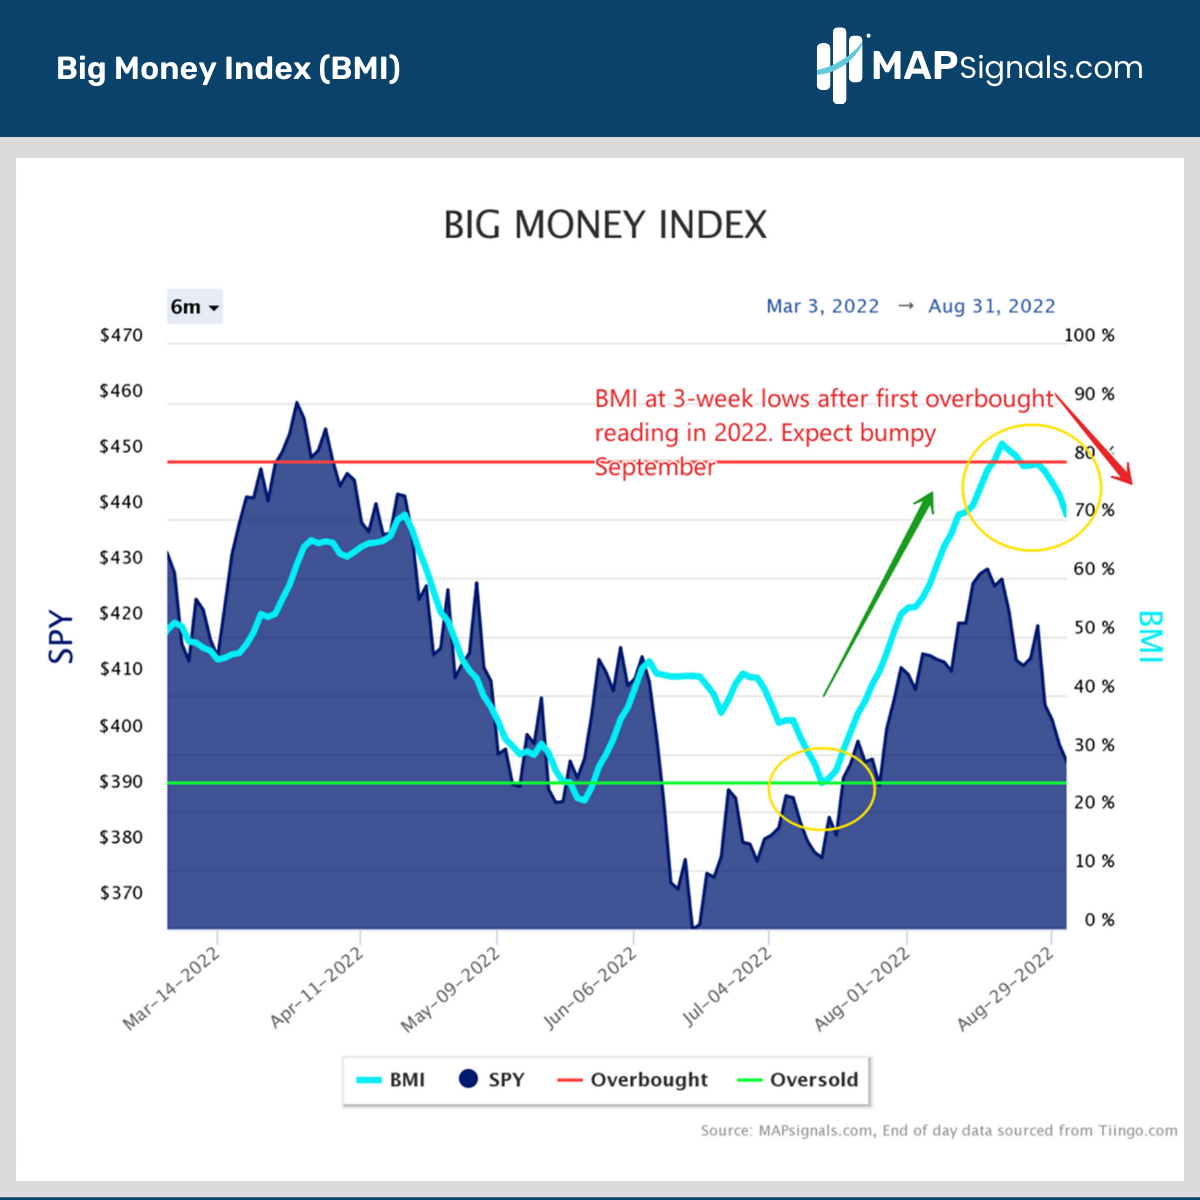
  7. Then in August our BMI reached overbought conditions (80%) for the first time since December 2020. That prefaced the signal to take profits once it fell below 75%:Overbought BMI Falling Below 75 Spells Trouble For Stocks | MAPsignals
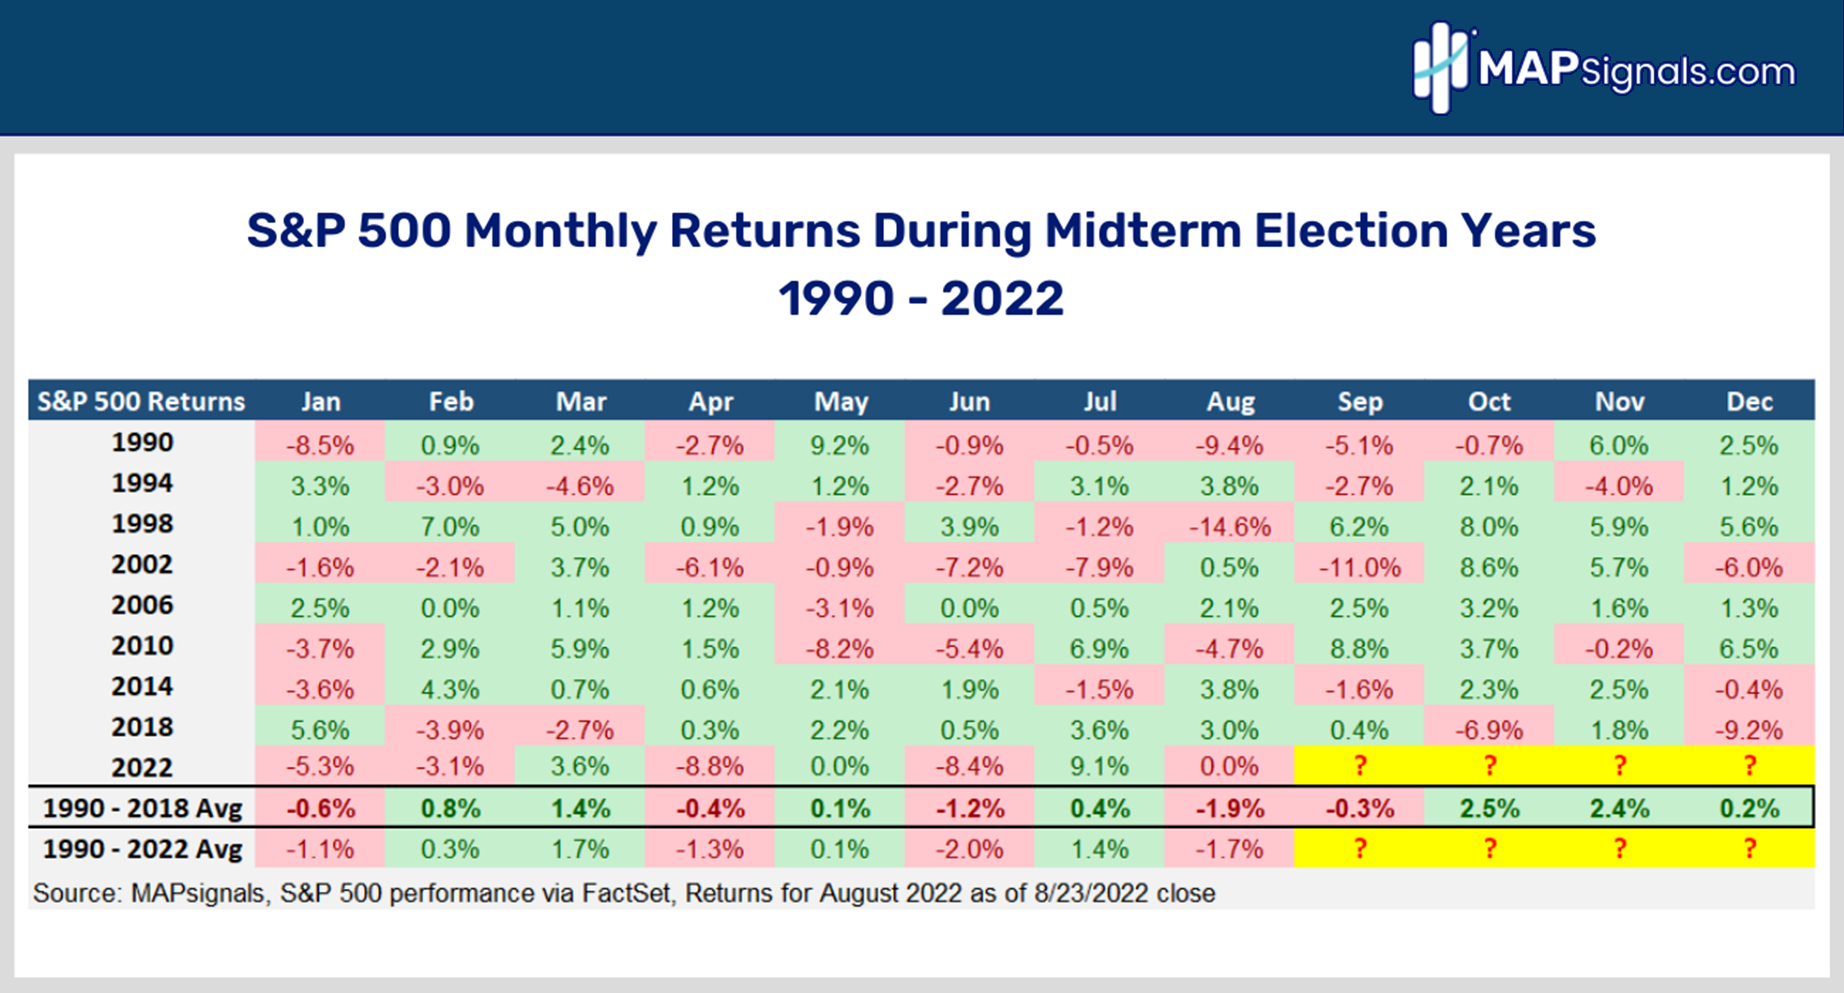
  8. August was a busy month as I laid out our midterm election playbook. Since 1990 in midterm election years, expect weak Septembers and strong Octobers & Novembers:S&P 500 Monthly Returns During Midterm Election Years 1990-2022 | MAPsignals
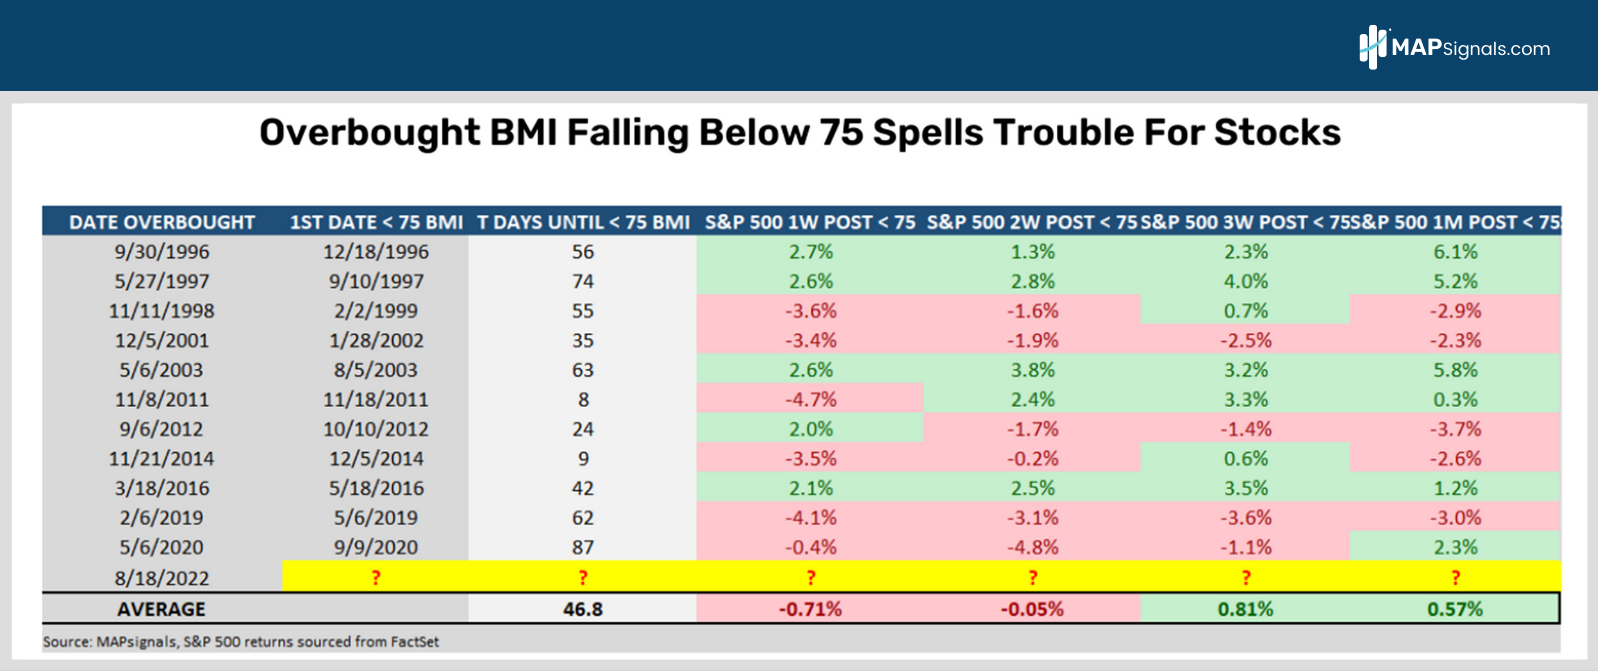
  9. Then came September when the case was made to prepare for September volatility. The BMI broke below 75% and reached oversold that month:Big Money Index Reaches first overbought reading in 2022 - Expect bumpy September | MAPsignals
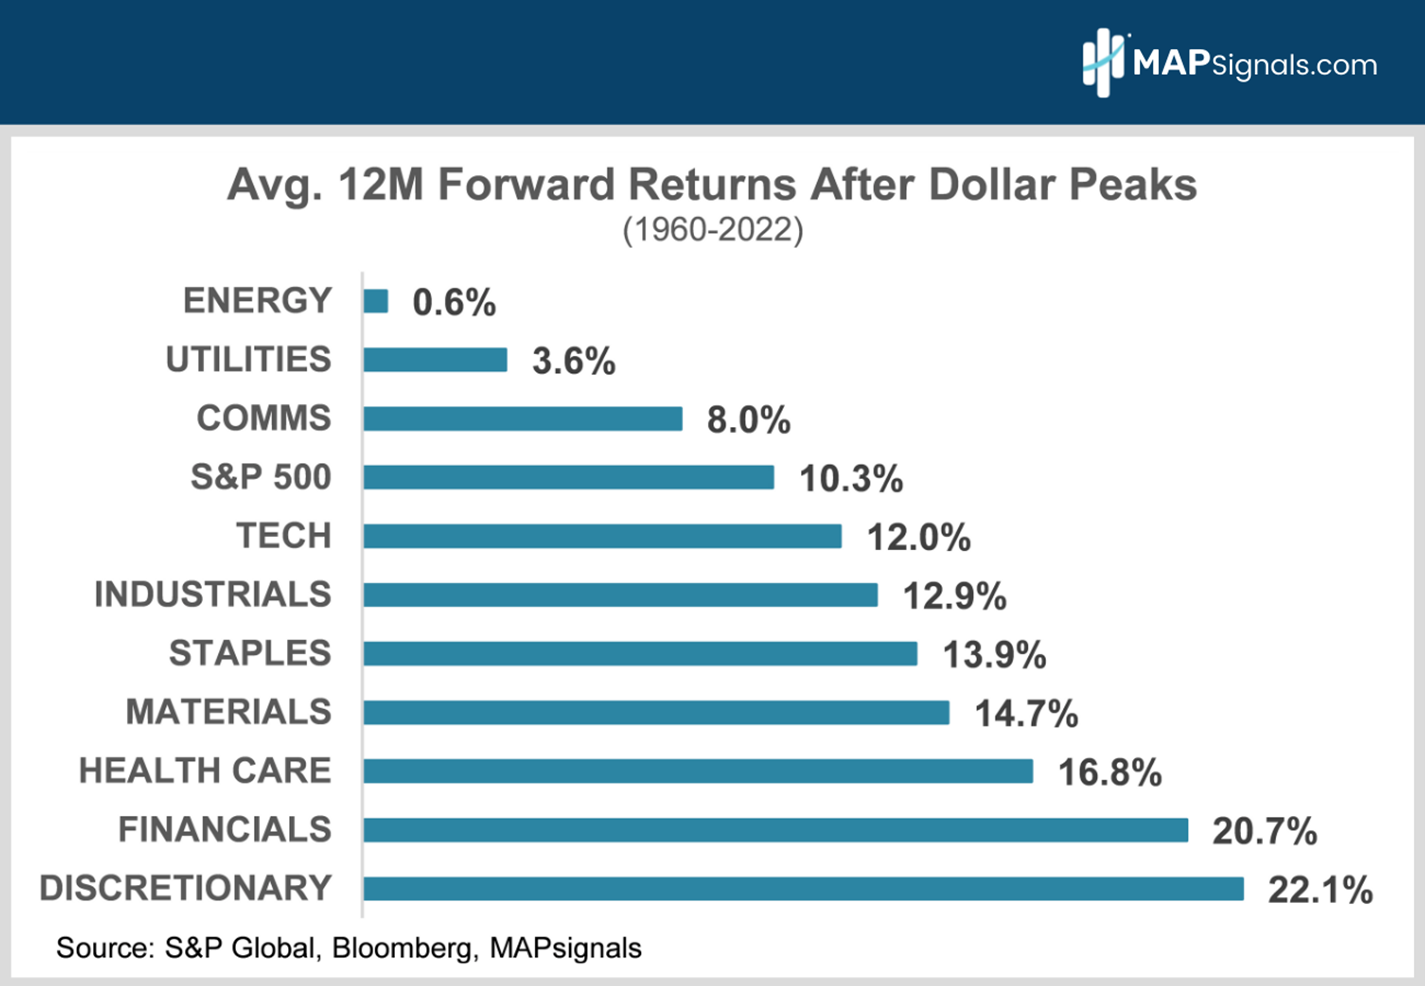
  10. Now on to October when many were worried over the dollar’s rise. Alec researched how stocks fare after the dollar peaks. Discretionary, Financials, and Health Care stocks jump the most 12 months post the dollar peaking:Average 12M Forward Returns after dollar peaks | MAPsignals
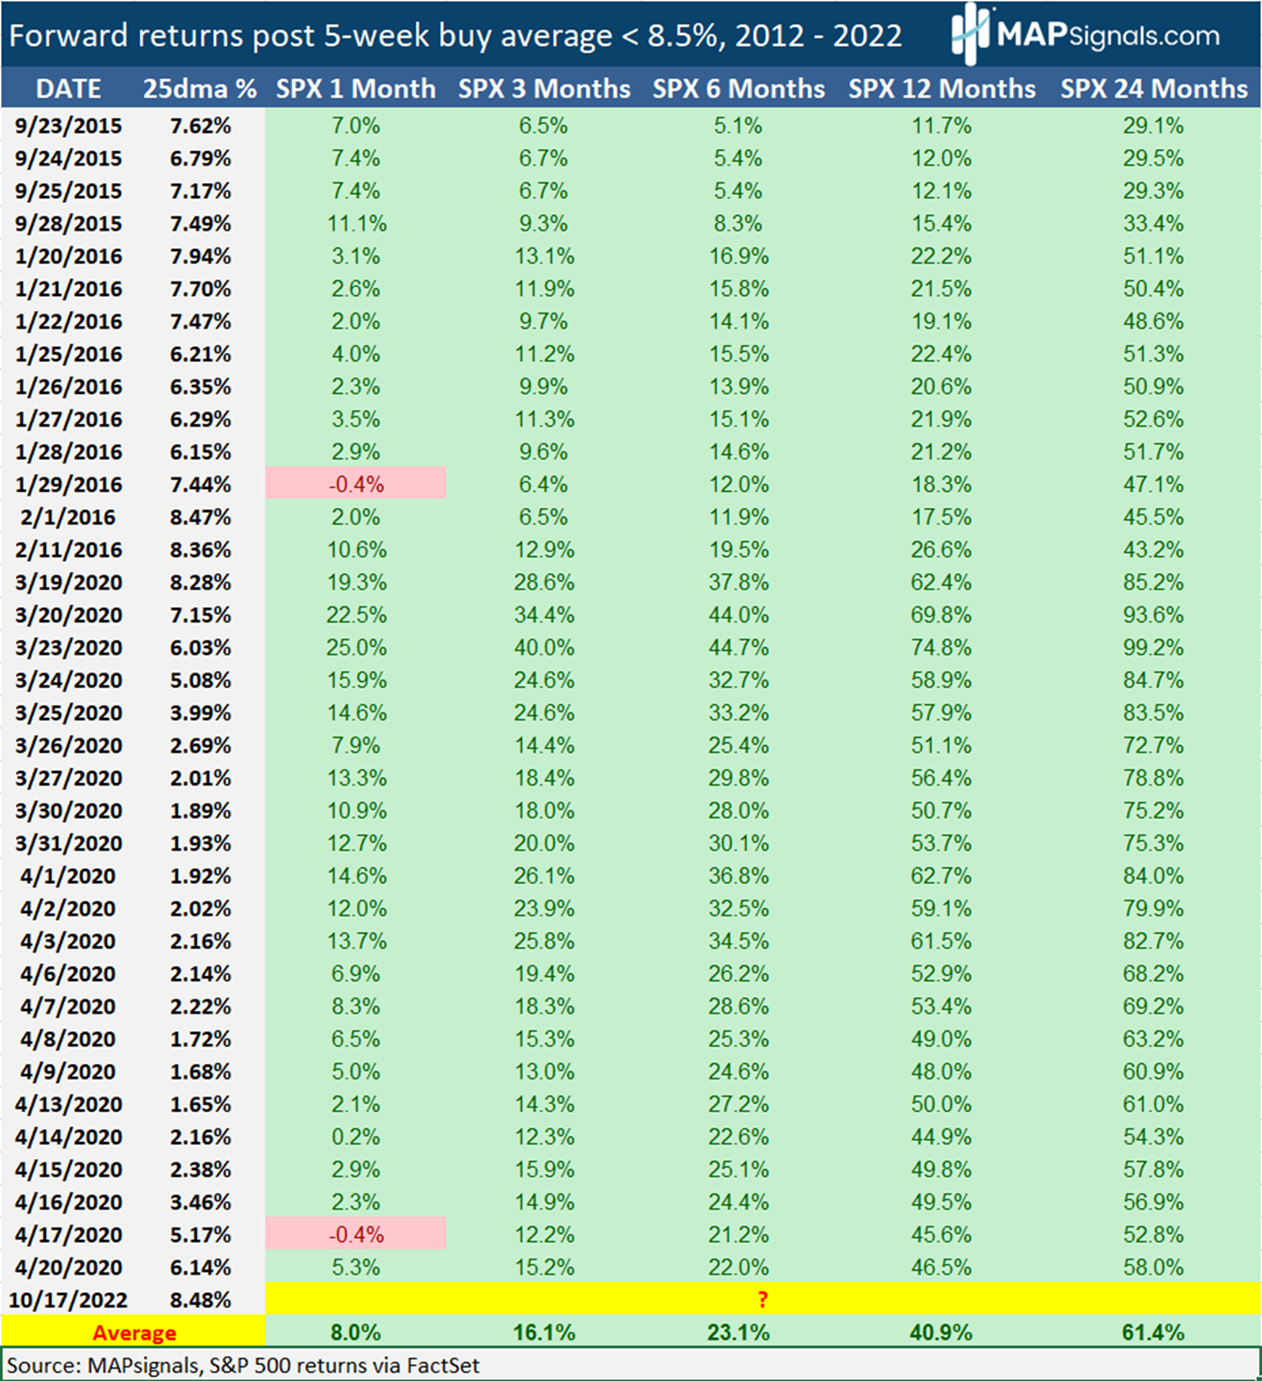
  11. Later that month a rare bullish signal triggered. Our data saw the weakest breadth reading since April of 2020. The forward 12- and 24-month returns post this signal have been green in all instances since 2012:Forward Returns post 5-week buy average greater than 8.5 percent | MAPsignals
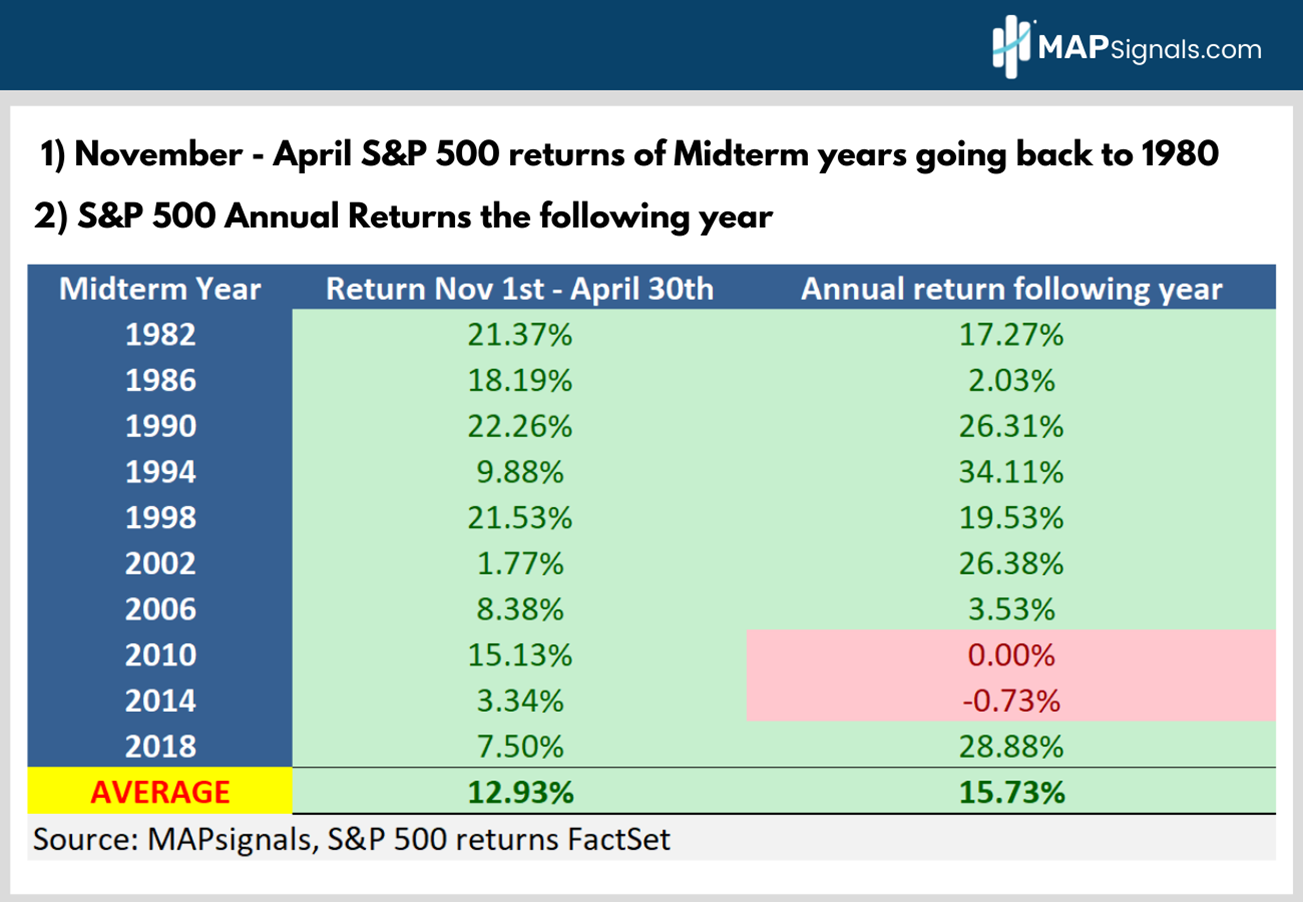
  12. In November, I laid out our post midterm election stock market gameplan. Stocks and the BMI tend to rise in December and January. I made the case that we could be looking at large rally into the year end. Unfortunately, that part of the roadmap didn’t go as planned. However, November – April in post midterm election years have been green in every instance since 1982:S&P 500 Midterm Election Returns 1980-Present | MAPsignals
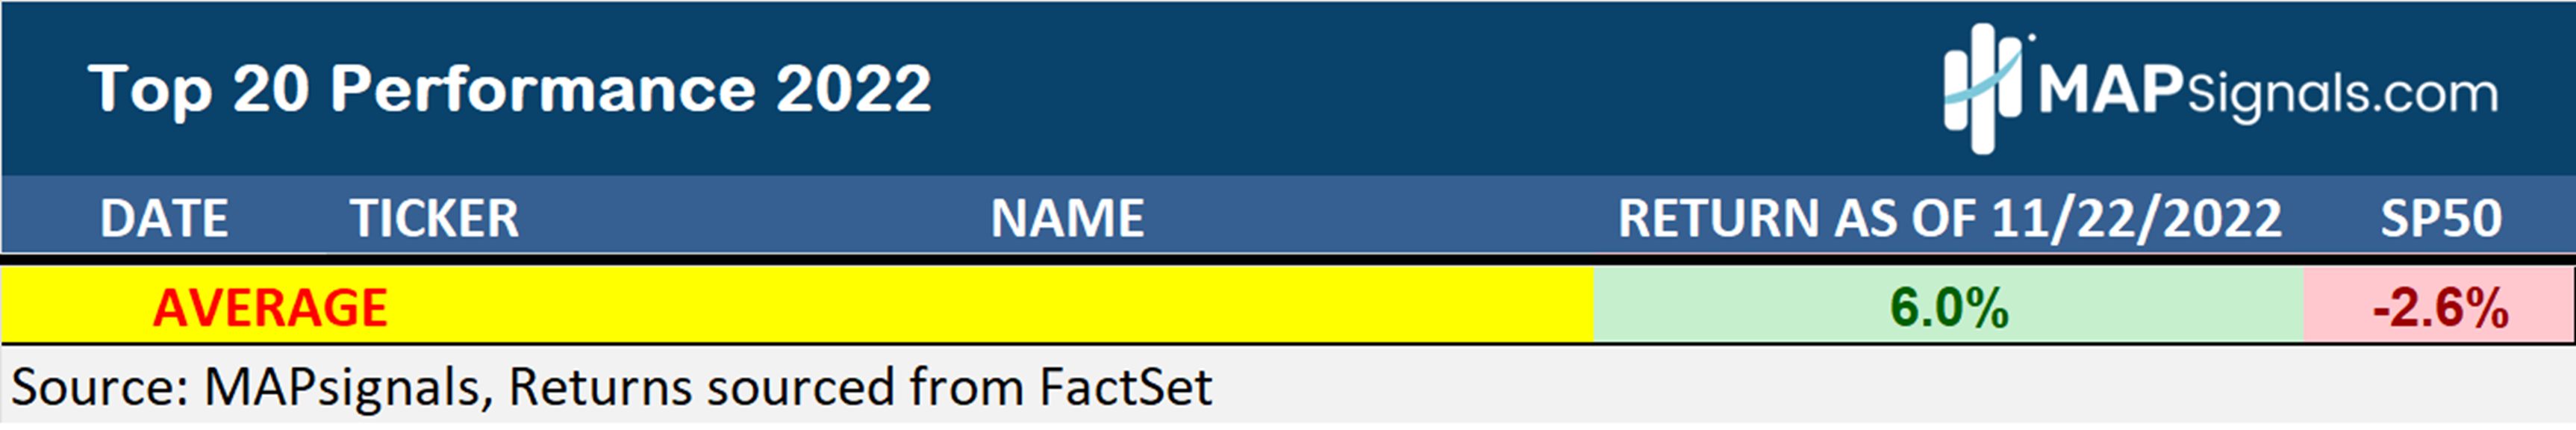
  13. Later in November I posted our Big Money Review for 2022. Even in one of the toughest bear markets in recent memory, MAPsignals top stocks beat the S&P 500 handily. Of the 88 stocks profiled, they averaged a +6% performance vs -2.6% for the market. I’m proud of that!MAP Top 20 Performance 2022 | MAPsignals
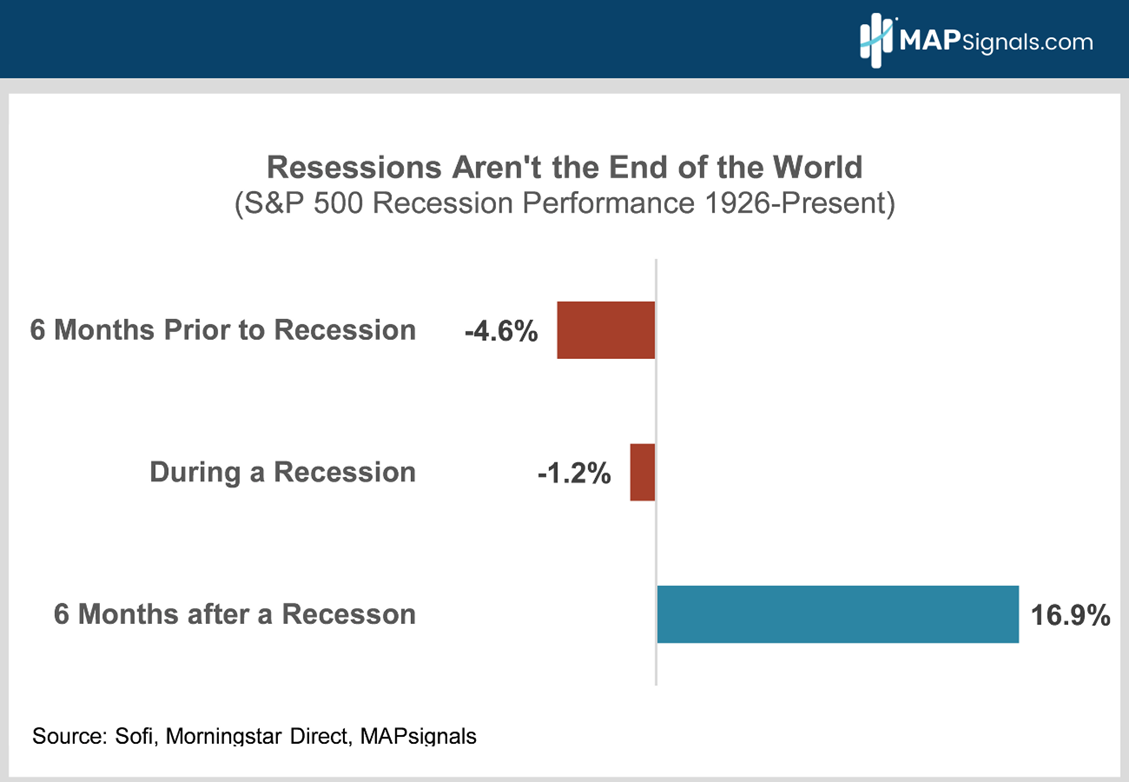
  14. Lastly to round out 2022, Alec laid his macro outlook for 2023: Why stocks can be a good bet. He covered recession fears, inflation worries, the earnings apocalypse, and valuations in this awesome piece. As we head into a new year, keep in mind that recessions aren’t the end of the world.

Six months prior to a recession, stocks fare the worst with an average loss of -4.6%. In the six-month period after a recession, the S&P 500 vaults an average of 16.9%. That’s something to look forward to:

S&P 500 Recession Performance 1926-Present | MAPsignals

And that’s a great way to close the books on this unforgettable year – on a high note!

Here’s the bottom line: 2022 has come to a close. And I’m sure many are glad it’s over!

Investors witnessed plenty of tough conditions from a macro standpoint: high rates, elevated energy costs, wars, a strong dollar, and a bear market to name a few. Our Big Money Index reached oversold an incredible 4 times.

Even still, we found plenty of leading stocks and sectors for subscribers. While no one bats 1000, we look for opportunity in any market. We keep it simple: Just follow the flow the money.

Our goal at MAPsignals is to provide a lens into where Big Money Investors are placing their bets and educate you along the way. Understanding positioning and the macro factors that drive stock prices is a great edge in any environment. Our portal brings you that info daily each morning.

My bet is 2023 will bring better returns and more positivity than you expect.

Here’s to wishing you and your family a great holiday season.

Happy New Year from the MAPsignals family.

Give our research a try for 2023, sign up here.

Lucas Downey
Lucas Downey

Lucas is co-founder of MAPsignals. His full bio can be found here.
Prior to MAP, he was Head of ETF Sales at Cantor Fitzgerald & SVP of Derivatives at Jefferies, LLC.

Spread the word!

Category: All, Big Money Insights Weekly

Previous Post: «Find Winning Stocks in a Bear Market Find Winning Stocks in a Bear Market
Next Post: How Hedge Funds Trade Options How Hedge Funds Trade Options»

Reader Interactions

Leave a Reply Cancel reply

Your email address will not be published. Required fields are marked *

Primary Sidebar

Get Big Money Insights for FREE

Want to know where the Big Money is headed?

Just enter your email address below. You'll get our FREE NEWSLETTER sent directly to your inbox.

We call it Big Money Insights... It’s your weekly sneak peek at the powerful market-moving forces that are hidden from 99% of investors.

"*" indicates required fields

This field is for validation purposes and should be left unchanged.

Categories

  • All
  • Big Money Insights Weekly
  • Big Money Series
  • Macro Insights
  • MAP In The Media
  • Members Only
  • Performance
  • Podcast
  • Special Reports
  • Stocks
  • Videos & Interviews
  • White Papers

Archives

  • February 2023
  • January 2023
  • December 2022
  • November 2022
  • October 2022
  • September 2022
  • August 2022
  • July 2022
  • June 2022
  • May 2022
  • April 2022
  • March 2022
  • February 2022
  • January 2022
  • December 2021
  • November 2021
  • October 2021
  • September 2021
  • August 2021
  • July 2021
  • June 2021
  • May 2021
  • April 2021
  • March 2021
  • February 2021
  • January 2021
  • December 2020
  • November 2020
  • October 2020
  • September 2020
  • August 2020
  • July 2020
  • June 2020
  • May 2020
  • April 2020
  • March 2020
  • February 2020
  • January 2020
  • December 2019
  • November 2019
  • October 2019
  • September 2019
  • August 2019
  • July 2019
  • June 2019
  • May 2019
  • April 2019
  • March 2019
  • February 2019
  • January 2019
  • December 2018
  • November 2018
  • October 2018
  • September 2018
  • August 2018

Follow us on Twitter

MAPsignals Follow 1,449 1,070

MAPsignals is a data platform that tracks institutional money flows in stocks and ETFs. Sign up for free insights here: https://t.co/SaAVHjKC9J

mapsignals
mapsignals avatar; MAPsignals @mapsignals ·
11h 1622987016957820928

One of my favorite #dividend #stocks having a day - Skyworks Solutions $SWKS - owned it for years

The $2B buyback is pretty significant given the market cap is sub $19B

#Semiconductors continue to see major inflows

Reply on Twitter 1622987016957820928 Retweet on Twitter 1622987016957820928 0 Like on Twitter 1622987016957820928 2 Twitter 1622987016957820928
Load More...

Footer

© 2021 Mapsignals.com

  • Home
  • Contact & Disclaimer
  • Privacy Policy
  • Terms & Conditions
  • Opt-out preferences
  • FAQ

Copyright © 2023 · Mai Law Pro on Genesis Framework · WordPress · Log in

✕
What Happened to Risk Assets White Paper is Here

Get your copy here and take a journey through our thoughts on margin and leverage.

Enter your email address below and you'll get our FREE NEWSLETTER sent directly to your inbox. 

 We call it Big Money Insights... It’s your weekly sneak peek at the powerful market-moving forces that are hidden from 99% of investors.